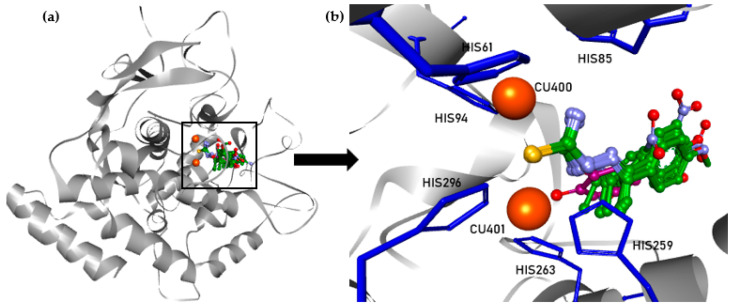
Figure 5.
Orientation of TSCs 1–12 and tropolone in chain A of tyrosinase (a) and the active site of tyrosinase (b). Copper ions are represented as orange spheres; histidine residues are represented as blue sticks; inhibitors are represented by balls and sticks (green—carbon of TSCs; purple—carbon of tropolone, yellow—sulfur; light blue—nitrogen; red—oxygen, hydrogens are not presented).

