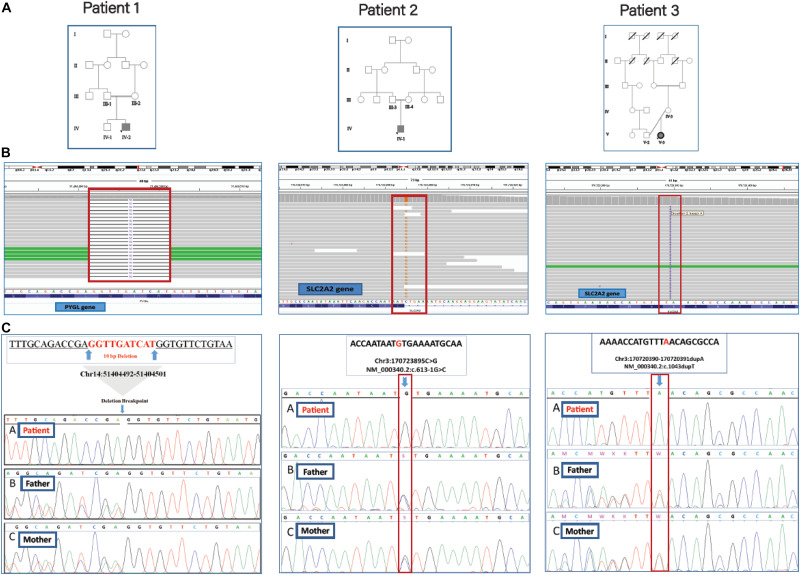
FIGURE 2.
The family trees, BAM interfaces, and segregation analysis results. (A) The pedigrees of patients 1, 2, and 3 were shown in which their parents are consanguine. (B) The WES reads were visualized by using the Integrative Genomics Viewer (IGV). (C) Sanger sequencing confirmation for the causative variants in homozygous patients and unaffected heterozygous parents.

