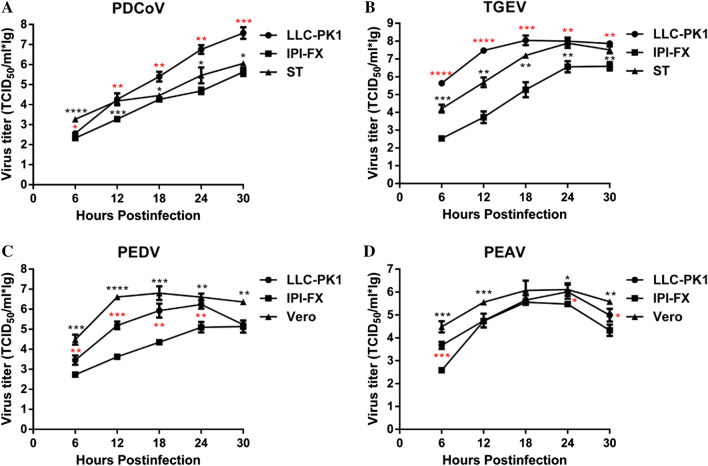
Fig. 3.
Growth curves of four porcine enteric CoVs measured by virus titration. (A) PDCoV growth curves in LLC-PK1, ST and IPI-FX cells. (B) TGEV growth curves in LLC-PK1, ST and IPI-FX cells. (C) PEDV growth curves in LLC-PK1, Vero and IPI-FX cells. (D) PEAV growth curves in LLC-PK1, Vero and IPI-FX cells. The mean titer and standard deviation were calculated from three independent experiments. Red marks represent differences between LLC-PK1 cells and IPI-FX cells, and black marks represent differences between ST and Vero cells. ****, P < 0.0001; ***, P < 0.001; **, P < 0.01; *, P < 0.05

