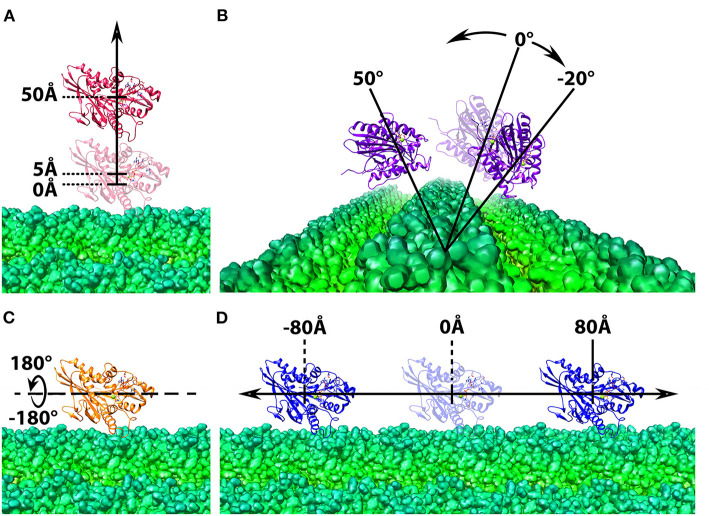
Figure 2.
Structure manipulation of the kinesin with respect to microtubule. In each of the four operations, the microtubule is shown at the bottom in green and shown in density map generated by chimera (Pettersen et al., 2004; Goddard et al., 2007), whereas the motor domain of kinesin is shown on the top in ribbon with various color, red, purple, orange, and blue. The motor domain is manipulated by (A) shifted from the microtubule from 5Å to 50Å in 2Å interval; (B) rotated around one chosen microtubule unit form −20Å to 50Å in 2Å interval; (C) spun from −180Å to 180Å in 2Å interval around the z-axis; (D) translated along the microtubule from −80Å to 80Å in 2Å interval.

