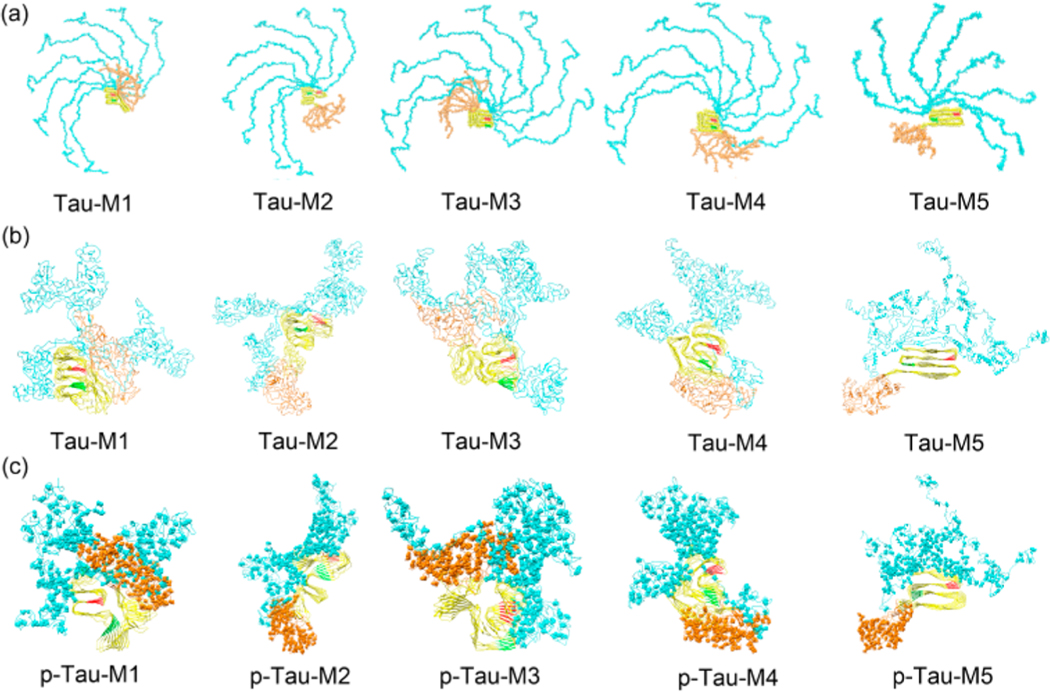
Figure 3.
Representative conformations for different normal and hyperphosphorylated tau filaments. (a) Initial conformations used in self-guided Langevin dynamics with the EEF1 solvent model. (b) Equilibrated conformations for tau filaments. (c) Hyperphosphorylated tau filaments. The N-terminus, repeat domain, and C-terminus of tau filaments are shown in cyan, yellow, and orange, respectively. Two hexapeptides (275VQIINK280 and 306VQIVYK311) are shown in red and green, respectively. Phosphorylated serine, threonine, tyrosine residues in both the N- and C-terminus are also shown as spheres.

