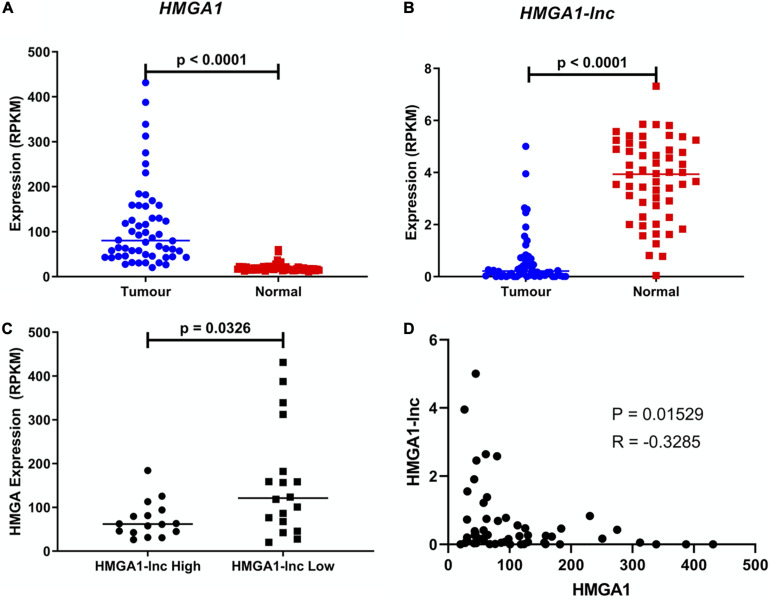
FIGURE 2.
Expression of HMGA1 and HMGA1-lnc in LUAD. Expression of HMGA1 is upregulated in LUAD compared to adjacent non-malignant tissue (Students T-test) (A) while conversely, expression of HMGA1-lnc is downregulated in tumors (Students T-test) (B). Additionally, tumors with high levels of HMGA1-lnc, have significantly lower levels of HMGA1, when compared to tumors with low levels of the lncRNA (Mann-Whitney U-test) (C), and expression of HMGA1 and HMGA1-lnc are negatively correlated (Spearman’s Correlation) (D). All data shown above is from the TCGA cohort (n = 108, 54 paired samples).

