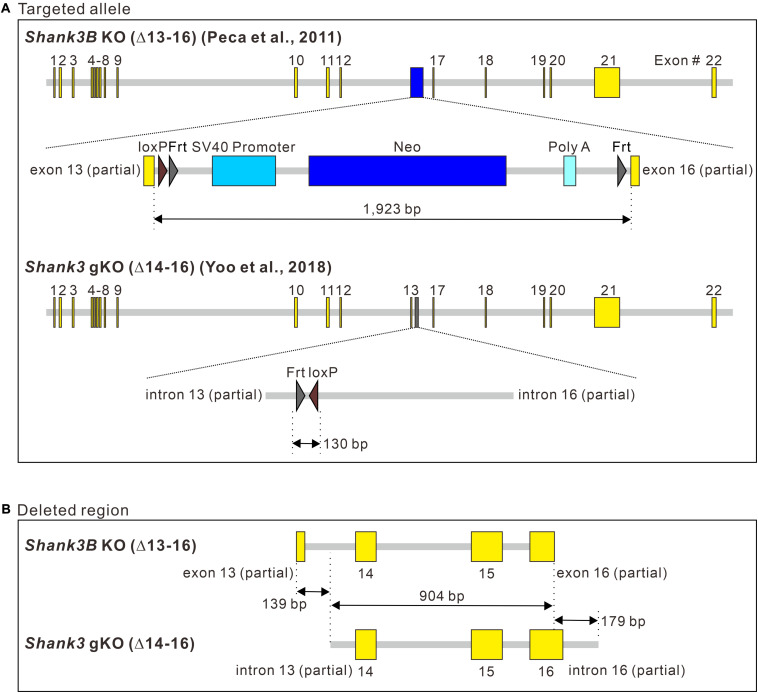
FIGURE 3.
Comparison of the targeted allele sequences of Shank3B KO and Shank3 gKO mice. (A) Schematic diagram showing the inserted sequences of the targeted alleles of Shank3B knock-out (KO) and Shank3 gKO mice. bp, base pair. (B) Schematic diagram showing side-by-side comparison of the deleted Shank3 exon and intron sequences in the targeted alleles of Shank3B KO and Shank3 gKO mice. Full sequencing information is provided in Supplementary Material (Supplementary Information 1).

