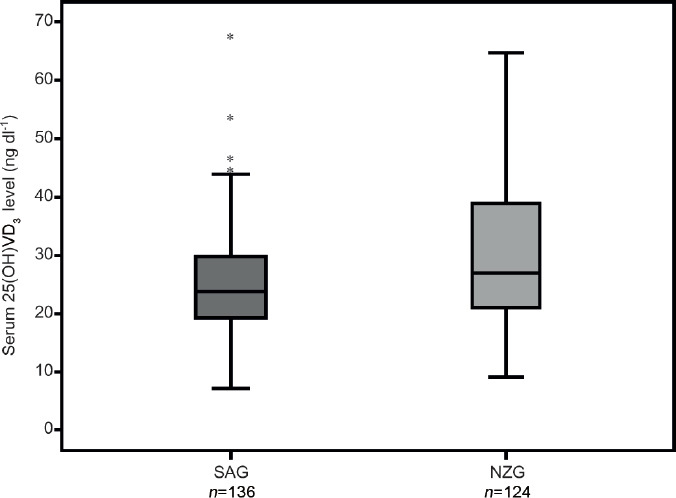
Figure 2.

Box-plot graph of 25-hydroxy-vitamin D3 serum levels distribution in both groups. The box displays the first quartile, median, and third quartile value distribution, whereas the horizontal line within it represents the median. Error bars represents the maximum and minimum VD3 levels and the black dots represents few outliers. *SAG: seminal abnormalities group; NZG: normozoospermic group; 25(OH)VD3: 25-hydroxy-vitamin D3; VD3: vitamin D.
