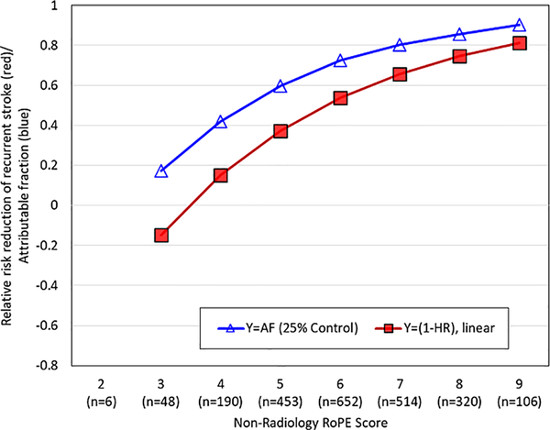
Figure 1:
RoPE – Estimated Attributable Fraction and Relative Risk Reduction (RRR) across Different RoPE scores
This figure depicts the RoPE-estimated attributable fraction (open blue triangles) and the RRR as estimated from a Cox model (red squares) against different RoPE scores. Higher RoPE scores are associated with much higher attributable fractions and much higher RRR. The estimated RRR correlated highly with the RoPE score estimated attributable fraction (r=0.88, p<0.001). Both the RoPE Equation and the 9-point RoPE score omit the neuroradiology variable to permit inclusion of the PC Trial data.
AF=attributable fraction; HR=hazard ratio.

