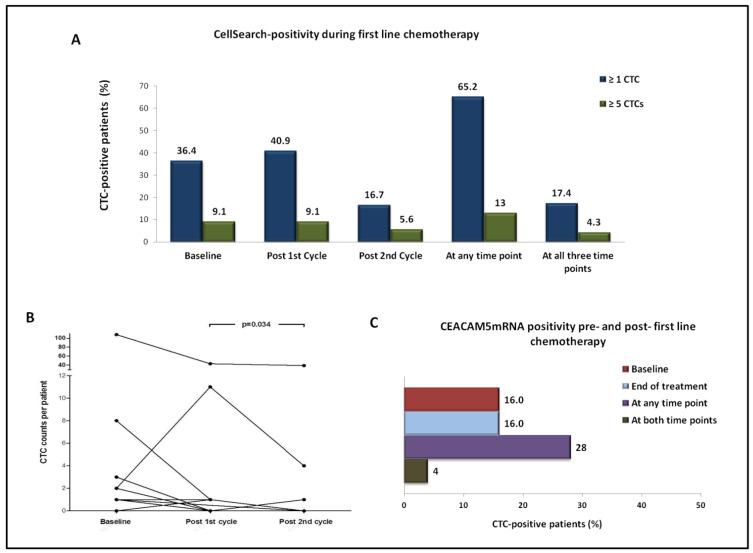
Figure 2.
Kinetics of CTCs during first-line chemotherapy by using different detection approaches. (A) Percentage of patients with detectable CTCs by CellSearch at different time points, using either ≥1 CTCs or ≥5 CTCs as a threshold for positivity. (B) Per patient distribution of CTCs detected using CellSearch at different time points. (C) Percentage of patients with detectable CTCs using the CEACAM5mRNA assay at the start and end of treatment.

