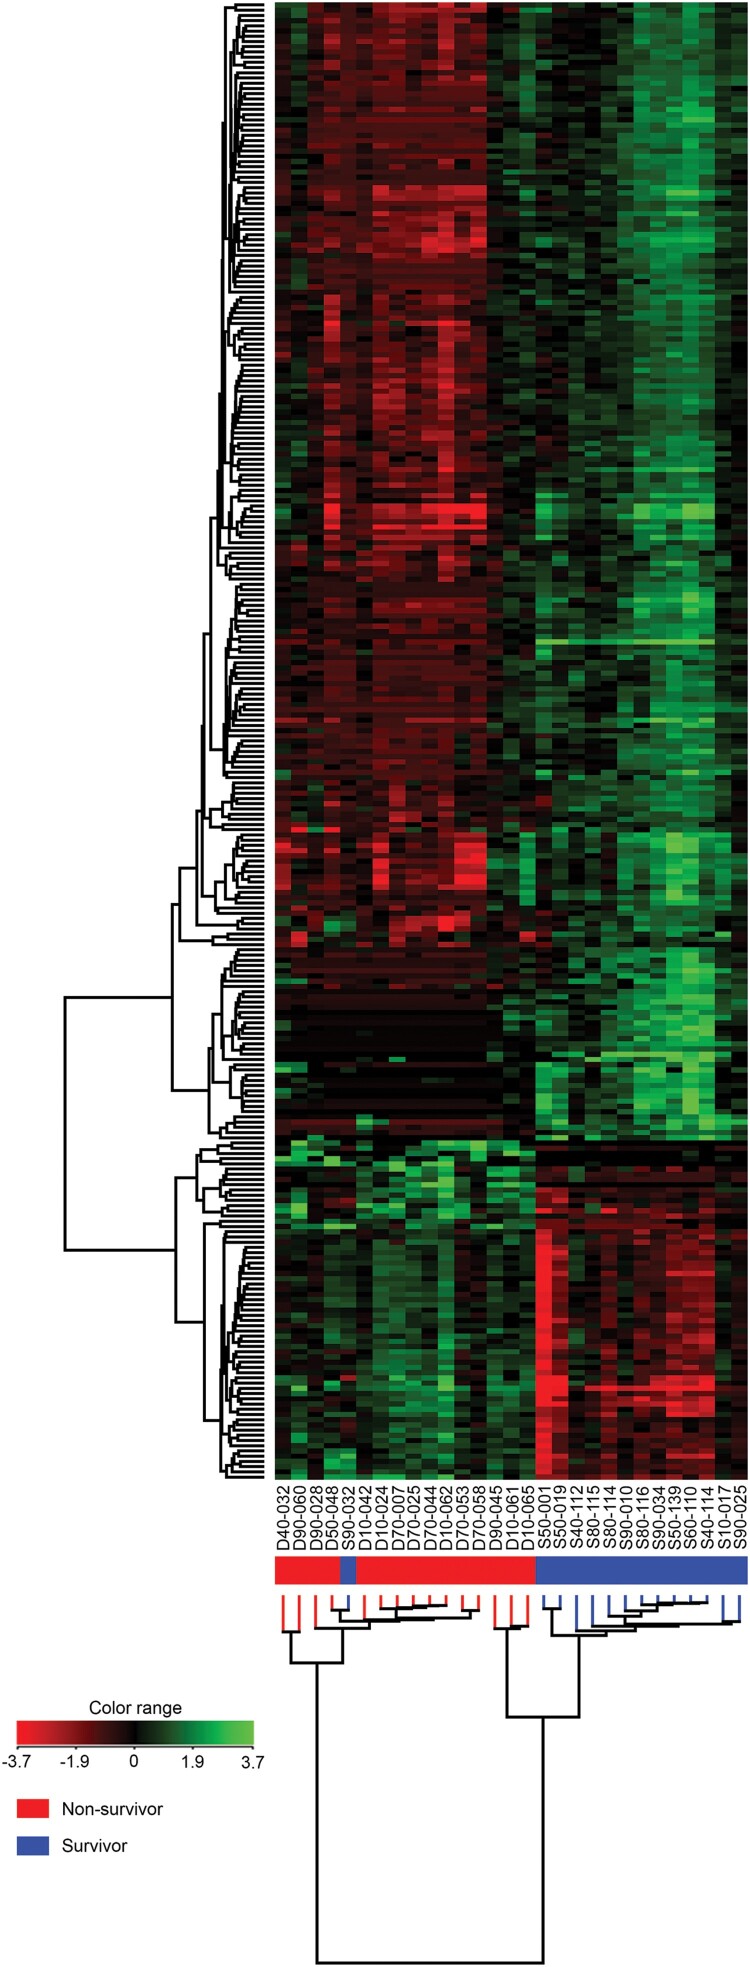
Figure 2.
Hierarchical clustering analysis of 283 differentially expressed genes (DEGs) in whole blood of surviving and non-surviving melioidosis patients. High expression of genes is shown in green whereas low expression of genes is shown in red. Each column represents individual subjects and each row in the figure represents one altered gene that significantly expressed at P ≤ 0.05 and fold change ≥ 2. Subjects from our study are melioidosis survivors (n = 14), melioidosis non-survivors (n = 15).

