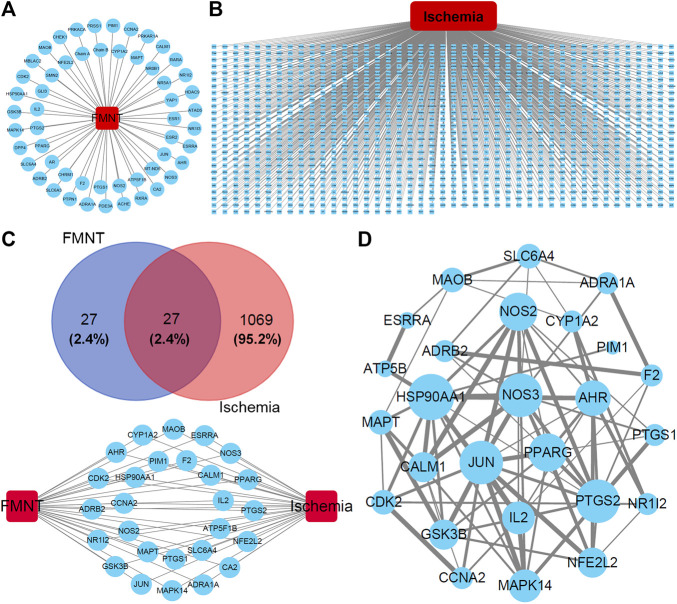
FIGURE 1.
Potential targets and their interactions for the effect of FMNT against ischemia. (A) Potential target network for FMNT. (B) Potential network involved in ischemia. (C) Common targets for both FMNT and ischemia. (D) Interaction network of the common targets for FMNT and ischemia. Blue nodes represented the targets with their sizes proportional to the degree centrality determined with topology analysis. Edge size represented the combined score. The data were from STRING database and produced with Cytoscape 3.7.2 software.

