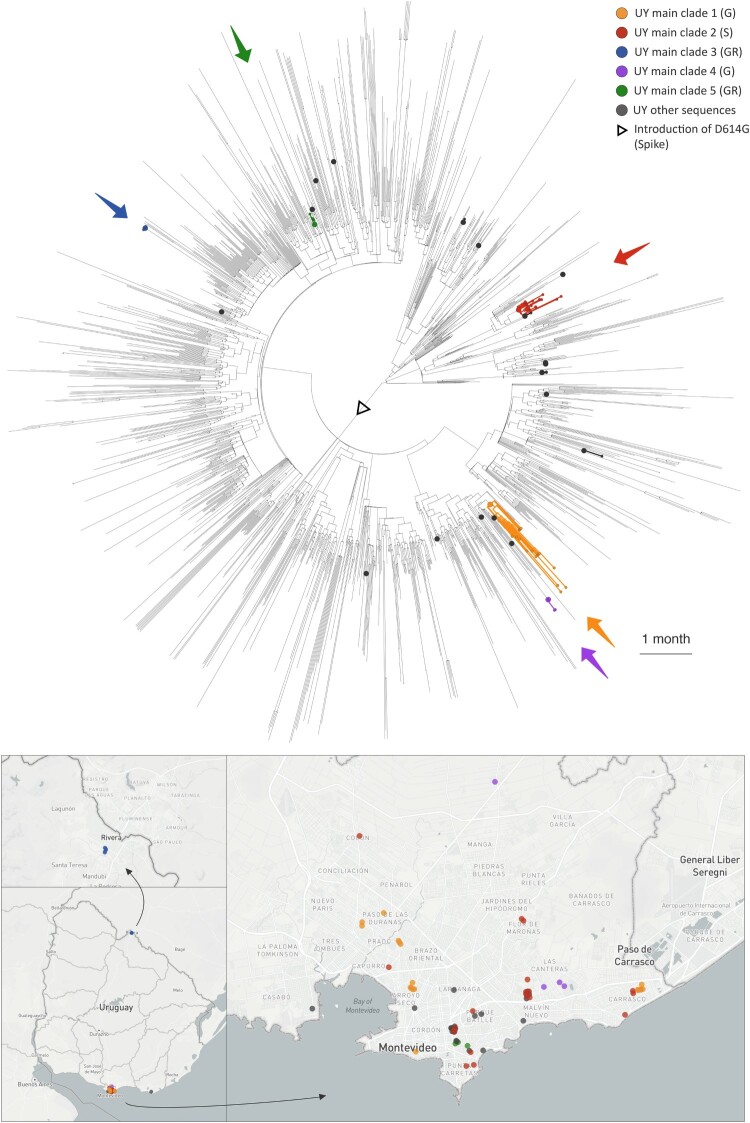
Figure 4.
Visualization of the evolutionary relationships and spatial distribution of SARS-CoV-2 samples in the five Uruguayan clusters. A time-scaled maximum clade credibility tree (MCC) was generated by the discrete phylogeographic analysis of 1,810 SARS-CoV-2 genomic sequences. Uruguayan sequences are shown as coloured circles, both in the phylogenetic tree and in the Uruguayan maps. The five main Uruguayan clusters are colour-coded according to the legend (clades indicated in brackets). The remaining Uruguayan sequences, which are based on introduction events that did not form subsequent transmission chains within Uruguay, are shown as grey circles.

