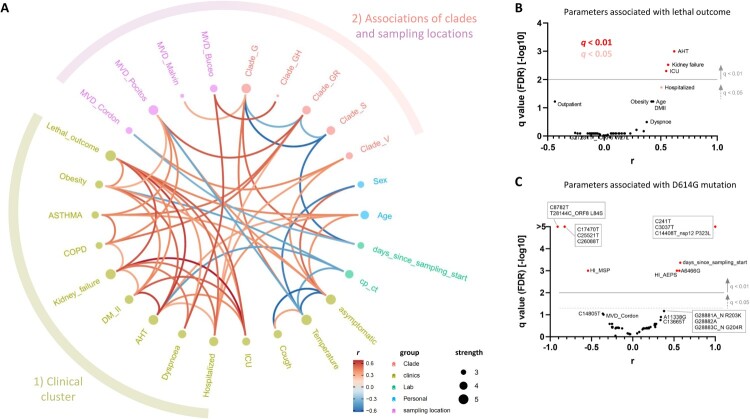
Figure 6.
Clade and clinical correlation analysis and study parameters associated with lethal outcome and spike D614G mutation. (A) In the edge bundling correlation plot, red and blue edges represent positive and negative correlations between connected parameters, respectively. Only significant correlations (P < 0.05) are displayed, and all parameters have at least two positive events. Nodes are colour-coded based on the grouping into clades, clinical, laboratory, neighbourhood, and personal data according to the legend at the bottom. Node size corresponds to the degree of relatedness of correlations. Surrounding circle segments highlight a strong clinical cluster and a less pronounced clade/sampling location cluster. (B) Volcano plot of parameters associated with lethal outcome. The full data set (see Figure 5 and Figure S9) was screened for parameters with false discovery rates (FDR) of q < 0.01 (red, considered significant) and 0.01 < q < 0.05 (pale red, considered borderline significant). (C) Volcano plot of parameters associated with the presence of D614G mutation in spike proteins of study participants’ infecting SARS-CoV-2 viruses. The same display was used as in B. Correlation analysis was done using nonparametric Spearman rank tests. All parameters that achieved P < 0.05 correlations are labelled. Parameters inheriting the same dot are boxed. MVD: Montevideo, HI: healthcare institution.

