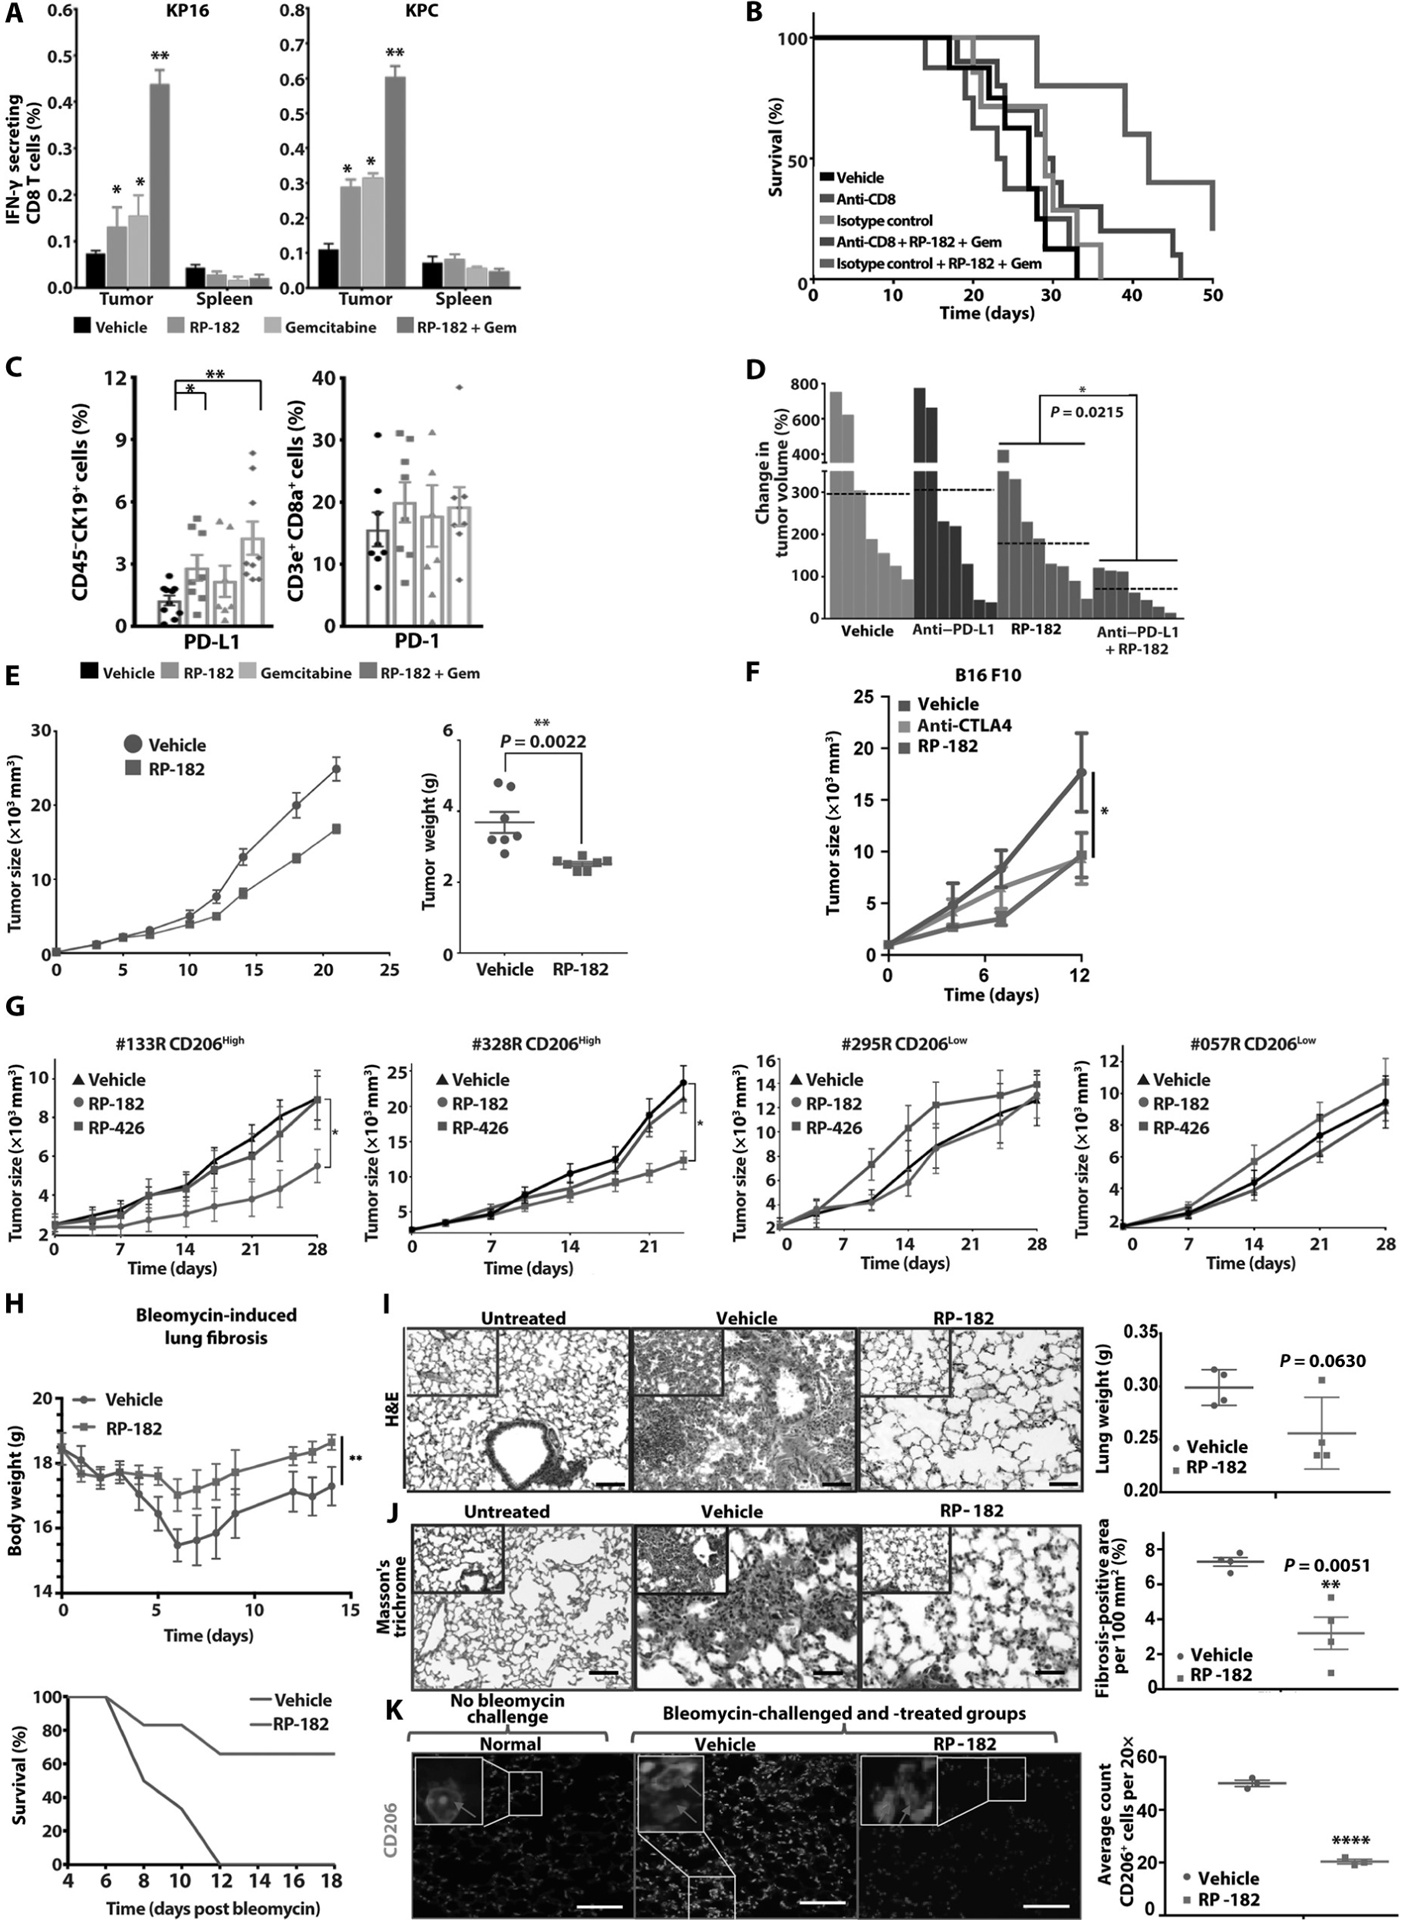
Fig. 7. RP-182 increases antitumor activity of CD8+ T cells and inhibits tumor growth in CD206high patient-derived pancreatic cancer xenografts.

(A) Quantification of enzyme-linked immune absorbent spots (ELISpots) (IFN-γ-secreting CD8+ T cells of added total CD8+ T cells) after coculture of KP16 (left) and KPC cancer cells (right) and CD8+ T cells isolated from tumors and spleens. (B) Kaplan-Meier analysis of KP16 mice treated with anti-CD8 neutralizing antibody, anti-IgG2 isotype control, and indicated combinations. (C) Quantification of flow cytometry analysis of CD45−CK19+ cancer cells expressing PD-L1 (left) and PD-1 expression on CD45+CD3e+CD8+ T cells (right) in KP16 tumors. (D) Best objective response (BOR) of KP16 tumors treated with vehicle (gray bars), anti-PD-L1 injections (purple), RP-182 (red), and anti-PD-L1 in combination with RP-182; n ≥ 7 animals per group. E. Tumor growth of CT-26 allografts, tumor weights at study endpoint shown on right. (F) Tumor growth of murine B16 melanoma. (G) Pancreatic cancer patient-derived xenotransplantation models that are CD206high (#133R, #328R) or CD206low (#295R, #057R) treated with RP-182, RP-426, or vehicle control; n ≥ 7 per group. (H) RP-182 administration rescues mice with chemically induced pulmonary fibrosis. Quantification of total body weights (in grams; top) and Kaplan-Meier survival analysis, error bars indicate SDs. (I) Pulmonary inflammatory infiltrates after bleomycin instillation. Images of H&E stains, quantification of measured weights of excised lungs on right; n = 4 per group. Scale bars, 50 μm. (J) Images of Masson’s trichrome staining, quantification of percent fibrosis positive area of 100 mm2 examined lung surface on right. Scale bars, 50 μm. (K) Reduction of CD206-positive alveolar cell infiltrate in RP-182-treated mice. Immunofluorescence lung field images of noninstilled and bleomycin-instilled mice treated with vehicle or RP-182 stained with DAPI and anti-CD206 (green). Scale bars, 100 μm. Red arrows in insets indicate CD206-positive cells. Quantification of number of CD206-positive cells shown on right, n = 4 per group.
