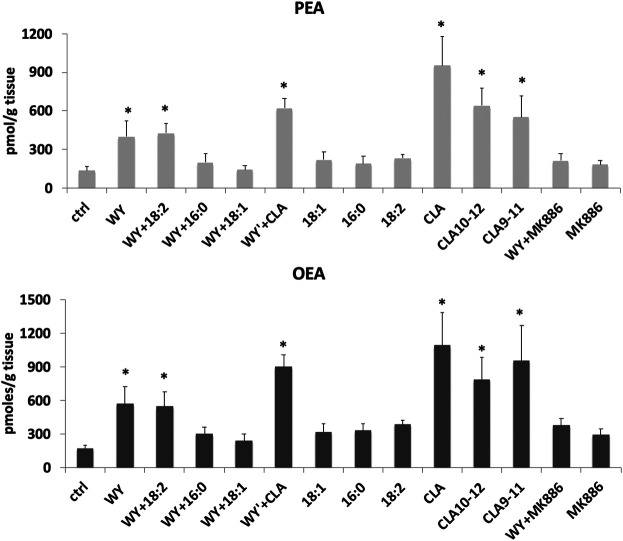
FIGURE 1.
Concentrations of palmitoylethanolamide (PEA) and oleoylethanolamide (OEA) analyzed by LC-MS as described in (Piras et al., 2015), in rat horizontal slices containing the midbrain incubated for 1 h with 100 µM of synthetic and endogenous ligands of PPARα or their vehicle: agonist WY14643 (WY), oleic acid (18:1), palmitic acid (16:0), linoleic acid (18:2), c9-t11, t10-c12, and a mixture of both CLA isomers (CLA), or PPARα antagonist (MK886). Error bars represent SD; n = 6. * denote significant differences (p < 0.05), vs. control (one-way ANOVA).

