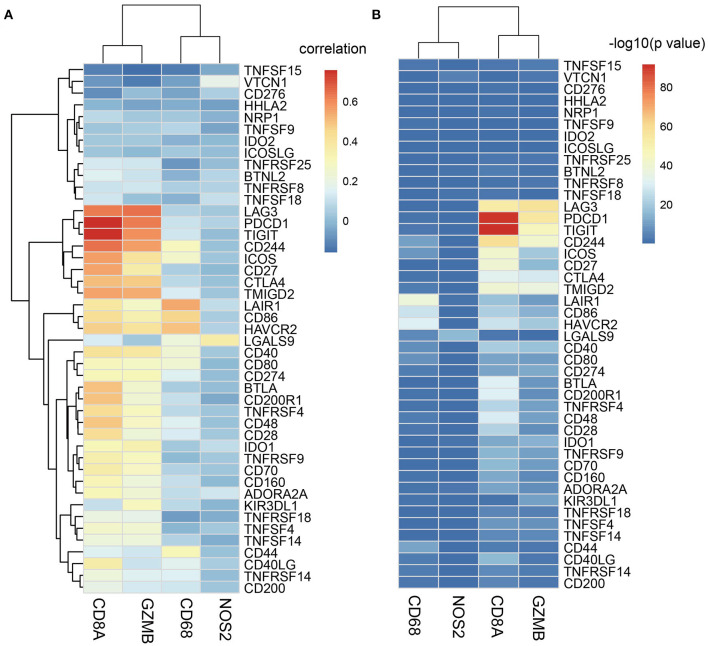
Figure 6.
(A) Heatmap of the correlation coefficients between ICGs and adaptive immune-resistance pathway genes. The abscissa represents the genes of the adaptive immune resistance pathway, and the ordinate represents the ICGs; (B) −log10 (P-value) is tested for the correlation coefficients between ICGs and adaptive immune-resistance pathway genes. The redder the color, the greater the significance.

