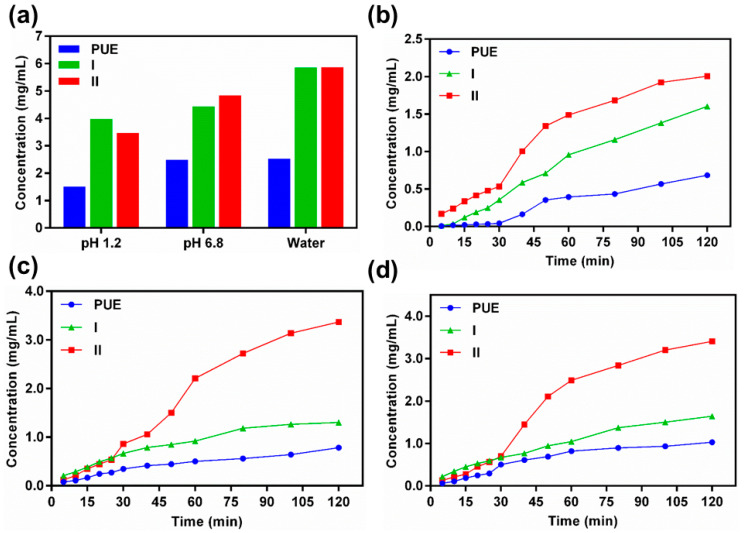
Figure 7.
A summary of the solubility profile of PUE, I and II in the gastrointestinal tract at pH 1.2, phosphate buffer at pH 6.8, and H2O at pH 7.0 (a), as well as the time-dependent dissolution profile of these compounds under respective conditions: gastrointestinal tract at pH 1.2 (b), phosphate buffer at pH 6.8 (c), and H2O at pH 7.0 (d), reflecting the dissolution rate of each compound. Data are expressed as average values from three replicates.

