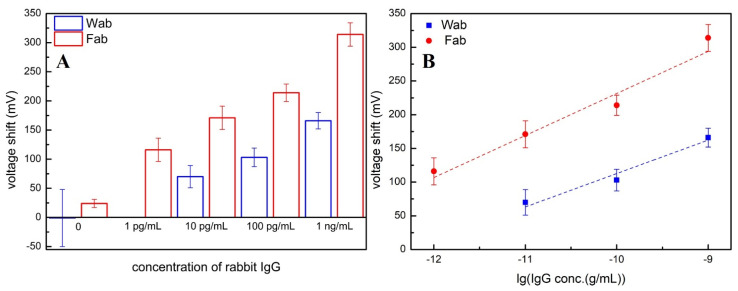
Figure 6.
(A) Comparison of the signal amplified by R18 (mV) after sensing rabbit IgG at various levels in 150 mM BTP by Wab/PEG-SiNWFETs (blue bars) and Fab/APTES-SiNWFETs (red bars). (B) Plot of the voltage shift by R18 versus logarithmic concentrations of rabbit IgG and two respective calibration lines obtained by Wab/PEG-SiNWFETs (blue line) and Fab/APTES-SiNWFETs (red line).

