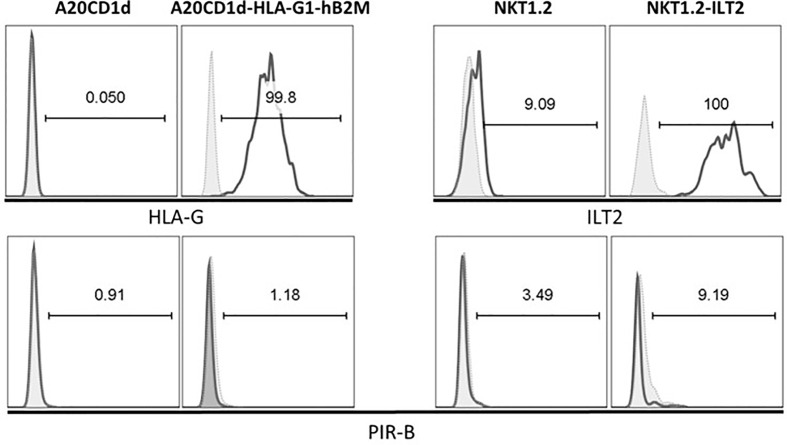
Figure 2.
A20CD1d and NKT1.2 cells lines generated to evaluate Human Leucocyte Antigen G (HLA-G):Immunoglobulin-like Transcript 2 (ILT2) inhibitory effect. A20CD1d and NKT1.2 cells were transduced to express HLA-G and ILT2, respectively. Flow cytometry was performed to measure the expression of HLA-G, ILT2, and PIR-B. Open histograms: staining for the indicated antibodies. Shaded histograms: isotype controls. Percentage of the parent population is indicated.

