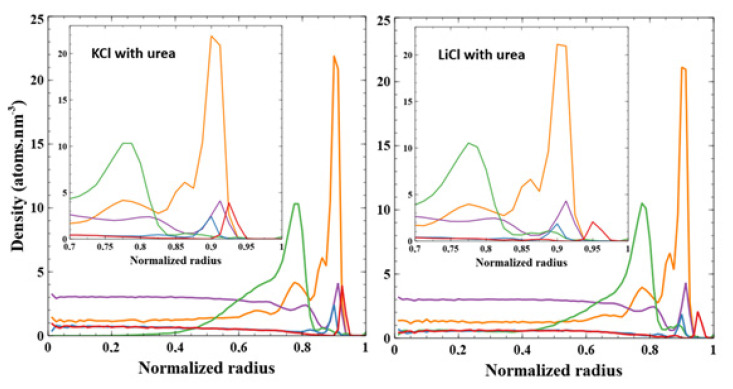
Figure 7.
Radial distributions of every component inside the tube after 40 ns of simulation averaged from the last 5 ns. Cations (either K+ or Li+) are shown in red and Cl− in blue. PEGs are shown in green. Water is represented in purple, its density in the graph is divided by 10 to improve clarity; urea is shown in orange. KCl solvent with urea is on the left graph while LiCl with urea is on the right.

