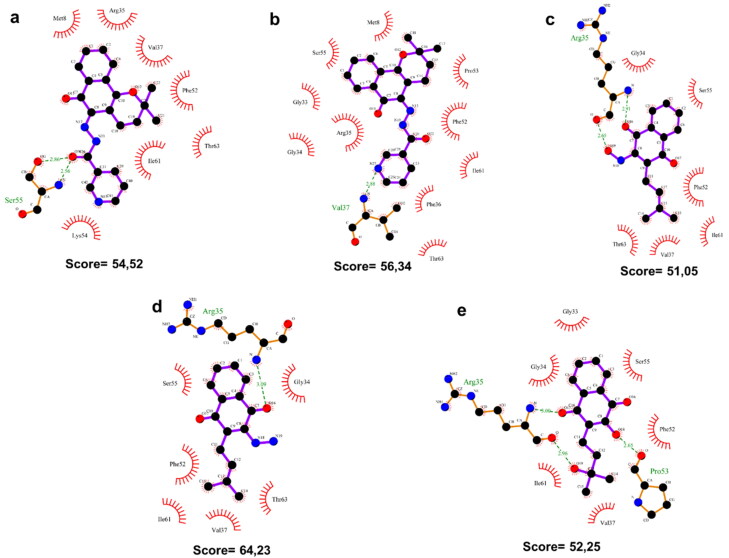
Figure 4.
2 D diagrams of interactions between lapachol derivatives and Nsp9 of SARS-CoV-2. Below each diagram, the respective ChemPLP docking score is shown. Green dashed lines indicate hydrogen bonds. Red arcs indicate hydrophobic interactions with the RNA binding site of Nsp9 of SARS-CoV-2. (a) Lapachol derivative V. (b) Lapachol derivative VI. (c) Lapachol derivative VIII. (d) Lapachol derivative IX. (e) Lapachol derivative XI.

