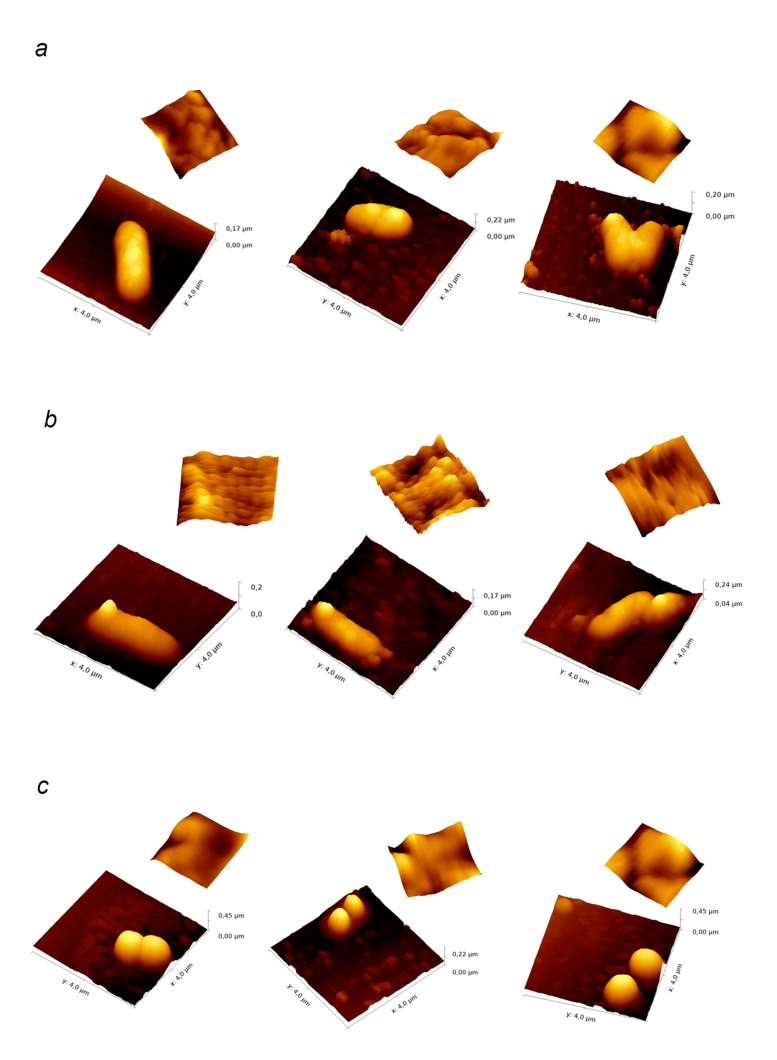
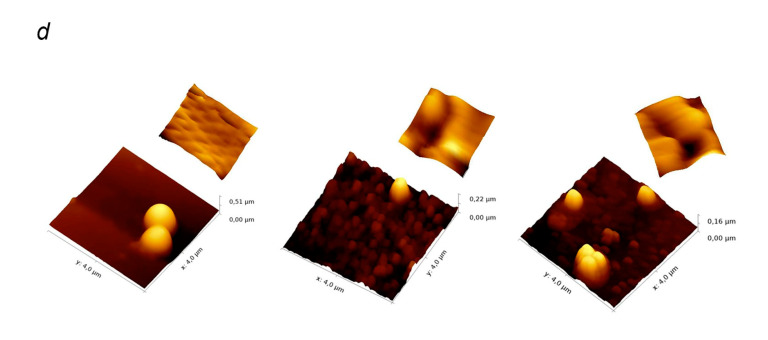
Figure 6.
(a,b). AFM images of bacteria treated with fucoidan F and Fo for 24 h ((a)—E. coli, (b)—B. licheniformis): (left) control; (middle) treated with fucoidan F; (right) treated with fucoidan Fo. Inserts show the surface topograms in 0.5 × 0.5 μm field. (c,d). AFM images of bacteria treated with fucoidan F and Fo for 24 h ((c)—S. aureus, (d)—S. epidermidis): (left) control; (middle) treated with fucoidan F; (right) treated with fucoidan Fo. Inserts show the surface topograms in 0.5 × 0.5 μm field.


