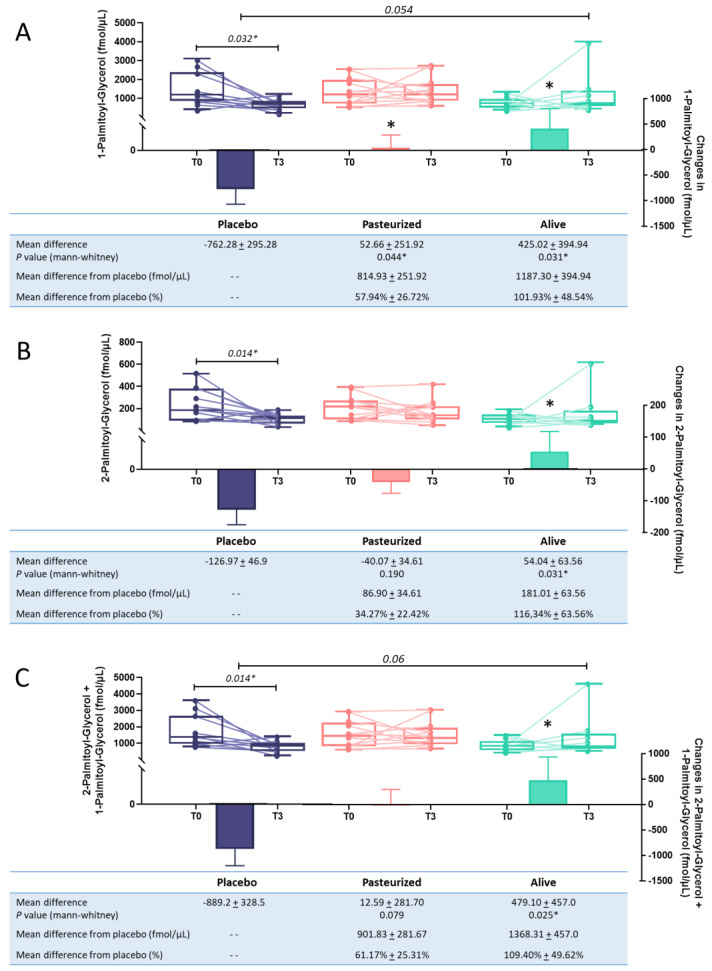
Figure 2.
Evolution of plasmatic levels for 1-Palmitoyl-glycerol (A), 2-Palmitoyl-glycerol (B), and the combination of the 2 isomeric forms (C) following the intervention. Purple color was used for the placebo group, pink for the pasteurized group and green for the alive group. Differential values (mean difference and mean difference from placebo) are expressed as the mean ± s.e.m., either as raw data or as percentages. The “- -” in the table refers to “non applicable”. The bars represent the delta per group with the corresponding s.e.m., which corresponds to the mean difference between the value at the end of the intervention and the baseline value. Two-tailed Mann–Whitney U-tests were performed to compare the differential values of both treated groups versus the placebo group (intergroup changes). Below each plot are indicated the respective p-values and when the test is significant, the bars are marked with an asterisk. The horizontal lines represent the evolution of the raw values before and after the intervention. The box-and-whiskers plot illustrates the distribution of the raw values for each timing within each group. The line in the middle of the box is plotted at the median, while the superior and inferior limits of the box correspond to the 75th and the 25th percentiles, respectively. The whiskers correspond to the maximum and minimum values. Two-tailed matched-pairs Wilcoxon’s signed-rank tests were performed to verify changes from baseline (intragroup changes). When the difference is significant, a capped line is marked above the relevant group with the corresponding p-value. Changes between 0 and 3 months across the 3 groups were analyzed with Kruskal–Wallis test; group-wise comparisons were performed using Dunnet’s corrections for multiple testing. When the difference is close to significant, a line is marked above the relevant groups with the corresponding p-value. Placebo group, n = 11; pasteurized bacteria group, n = 12; alive bacteria group, n = 9. * p < 0.05.

