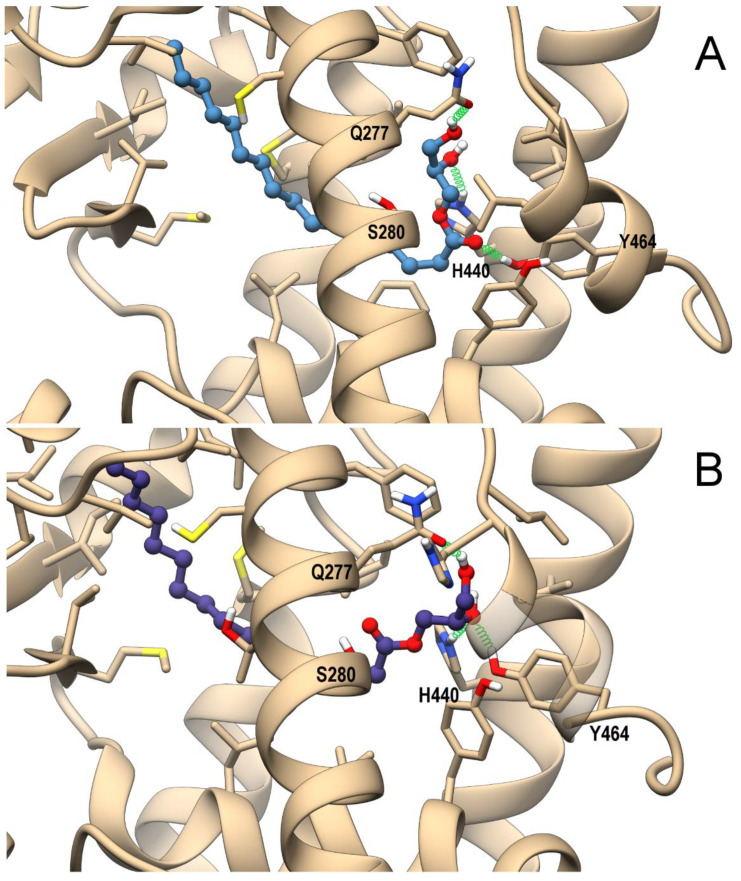
Figure 6.
Theoretical complexes of PPARα (tan) with D-PG (steel blue) (A) and L-PG (slate blue) (B) with 1-PG shown in ball & stick representation. Protein residues within 5 Å from the ligands are shown in stick representation. H-bonds are shown as green springs. Hydrogen, nitrogen, oxygen, and sulfur atom are painted white, blue, red, and yellow, respectively. A transparent surface for ribbons was used wherever they hide the ligand-binding site.

