FIGURE 4.

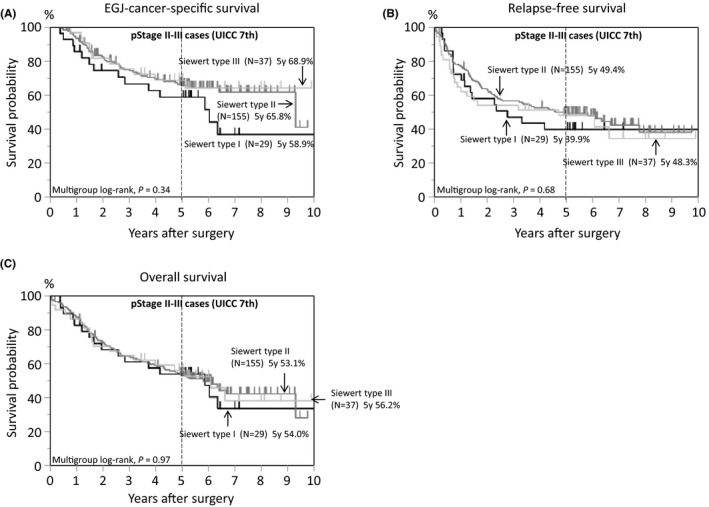
Kaplan‐Meier curves of pStage II‐III cases (N = 221) of esophagogastric junction (EGJ) adenocarcinoma according to tumor location by Siewert classification. A, EGJ‐cancer‐specific survival. B, Relapse‐free survival. C, Overall survival

Kaplan‐Meier curves of pStage II‐III cases (N = 221) of esophagogastric junction (EGJ) adenocarcinoma according to tumor location by Siewert classification. A, EGJ‐cancer‐specific survival. B, Relapse‐free survival. C, Overall survival