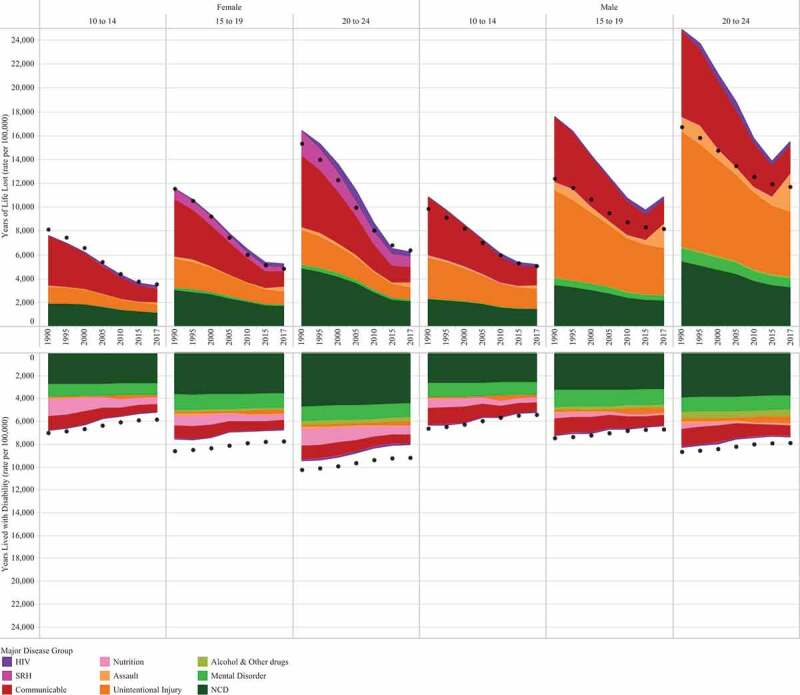
Figure 1.

Observed Years of Life Lost and Years Lost to Disability (rate per 100,000) for 10–24-year-olds in Myanmar across 9 categories, by age and sex. Data are from 1990 to 2017 and show overall trends using 5-year slices (the 2008 disaster is not shown). Dotted line indicates all-cause expected YLLs and YLDs. GBD (2017)
