
Figure 2.
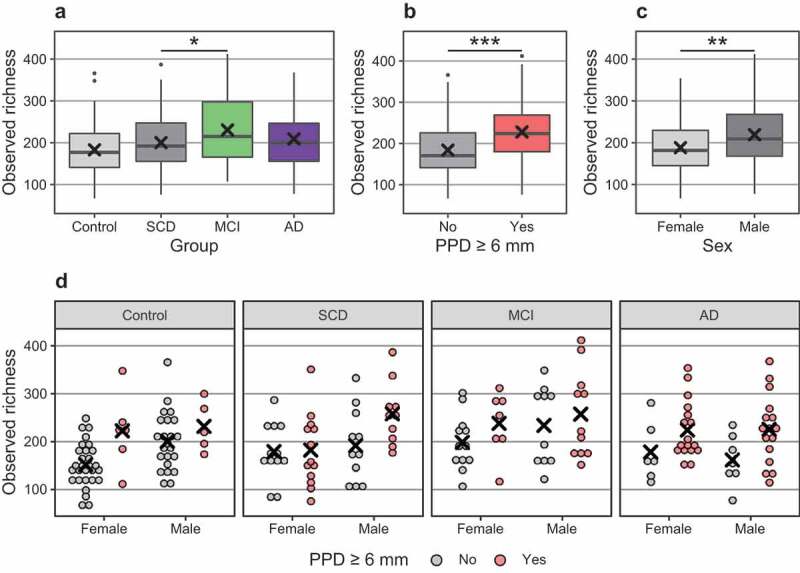
Differences in observed richness (number of detected bacterial OTUs) between groups. Note: x: mean. In boxplots, box hinges: 1st and 3rd quartiles, whiskers: box hinge to 1.5 * interquartile range. (a). Controls and diagnostic subgroups; (b). PPD ≥ 6 mm; (c). Sex; (d). Diagnostic subgroups, sex and PPD ≥ 6 mm