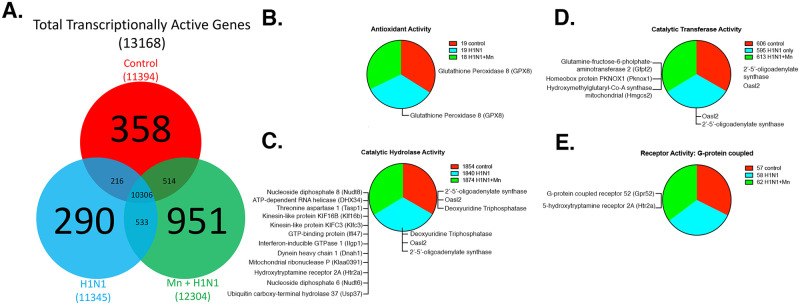
Fig 4. RNA sequencing of the H1N1+MnCl2 treatment group highlights uniquely transcribed genes annotated to functionally relevant biological processes.
(A) Venn diagram depicting unique and overlapping transcripts. (B-E) GO Consortium & PANTHER Classification System pathway analysis: Pie charts describe the relative proportions of RNAseq transcripts annotated to each GO Term within the molecular function Gene Ontology. The exact gene lists unique or uniquely absent from the H1N1+ Mn treatment group are listed for each category. Genes were classified according to molecular function and biological process with Panther overrepresentation and Functional Enrichment analyses. Groups: Control, H1N1, H1N1+ Mn.

