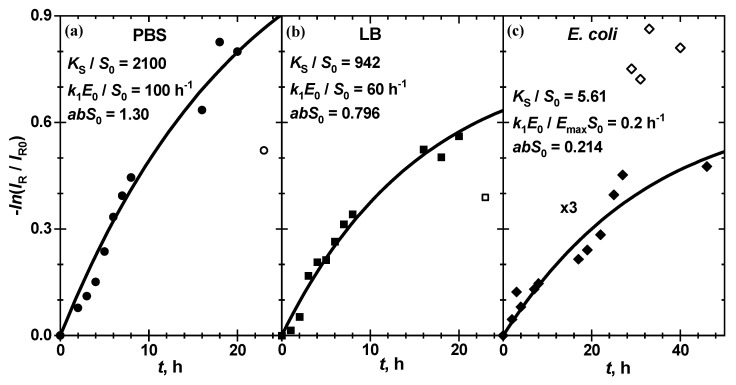
Figure 6.
Evolution of the relative chromatic intensity for the enzymatic cleavage of chitosan-g-X-Gluc by ß-Gus (a) in PBS at pH 7.4 (25 °C), (b) in LB at pH 7.0 (25 °C) as well as (c) in E. coli Mach1 bacterial suspension in LB at pH 7.0 (20 °C). The enzyme concentrations are 100 nM for (a) and 60 nM for (b). The stock bacterial suspension was diluted 5 times, corresponding to a bacteria concentration of 6 × 10⁷ colony-forming units (CFU)/mL. (c). The fit function (5) to the filled circles data points is shown with the solid line. The thermodynamic and kinetic constants as well as the scaling factor are shown in the panels. The outlier data points, which are not included in the analysis, are shown as open symbols.

