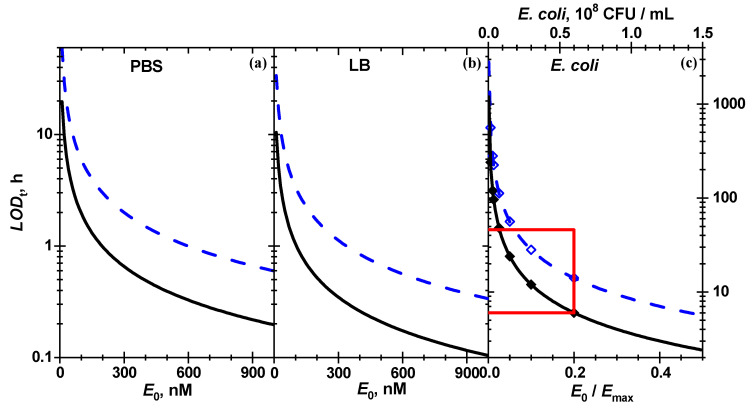
Figure 8.
The concentration dependence of for the enzymatic cleavage of chitosan-g-X-Gluc by (a,b) β-Gus solutions and (c) E. coli Mach1 triggered enzymatic hydrolysis in bacterial suspension for the data included in the global fit (solid black) and for all data (dashed blue). (c) The bacterial concentration in the dispersions is shown on the top axis. The minimal reaction times for the dilution used in the experiment are shown with diamonds. The red rectangle limits the area of the E. coli Mach1 detection studied in the present work.

