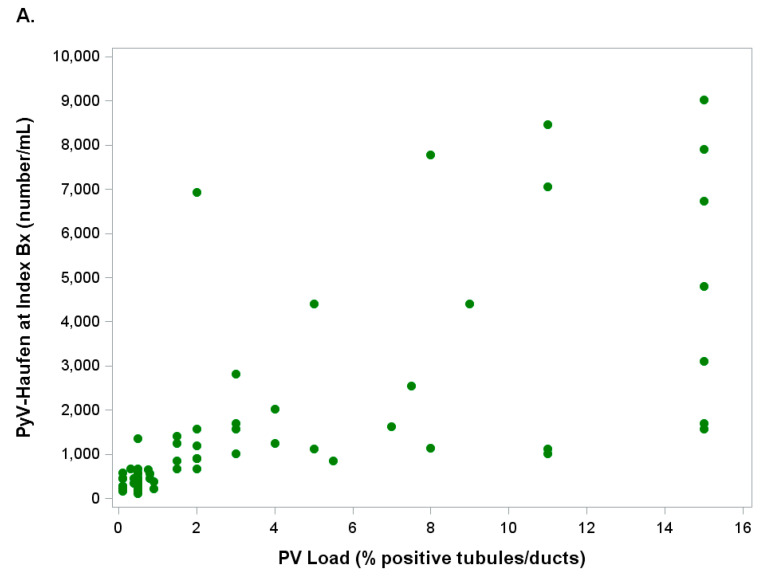
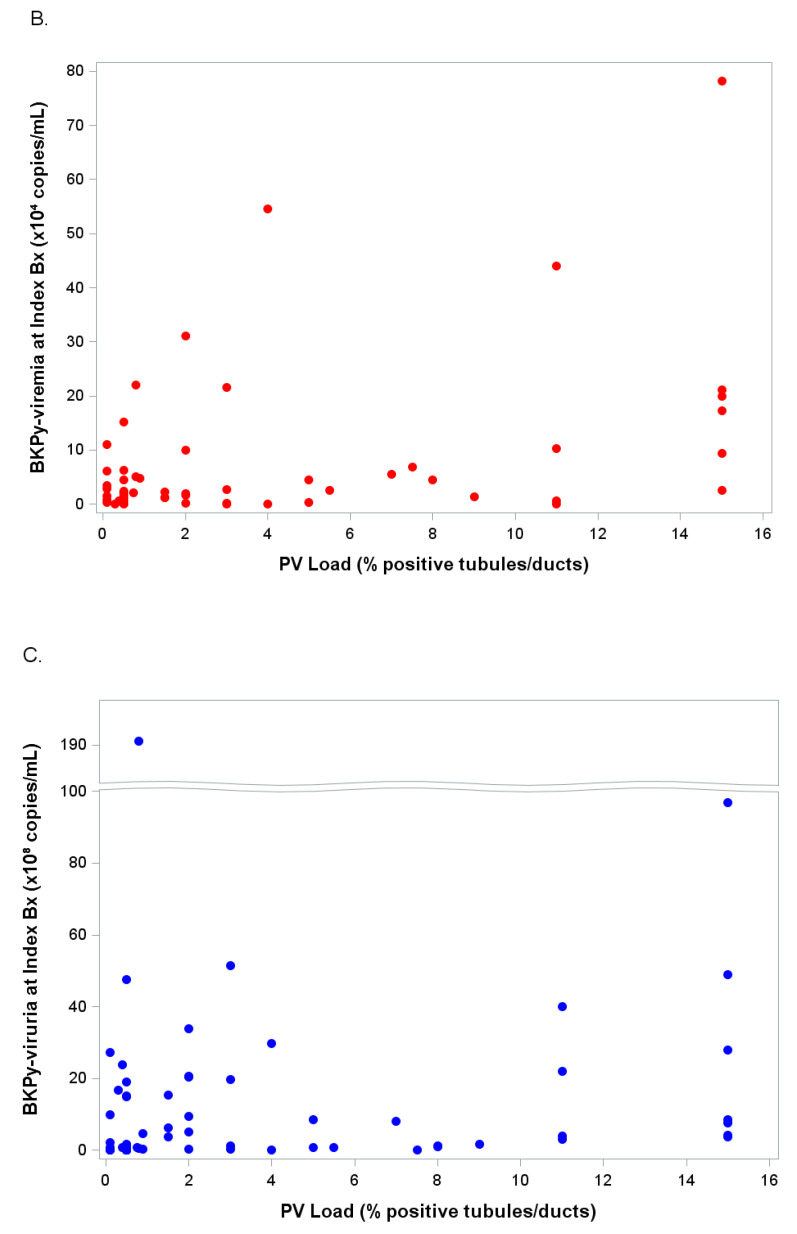
Figure 6.
(A–C): Scatter Plots. Illustrated are quantitative marker test results (y-axis) and PyVN disease severity (percentage of virally injured tubules/Banff pv load based on SV40-T expression by immunohistochemistry) in index biopsy (x-axis). For clarity, the x-axis is truncated at the 16% mark since >98% of index biopsies showed a pv load ≤16%. (A) PyV-Haufen shedding (green); (B) BKPy-viremia (red); (C) BKPy-viruria (blue).


