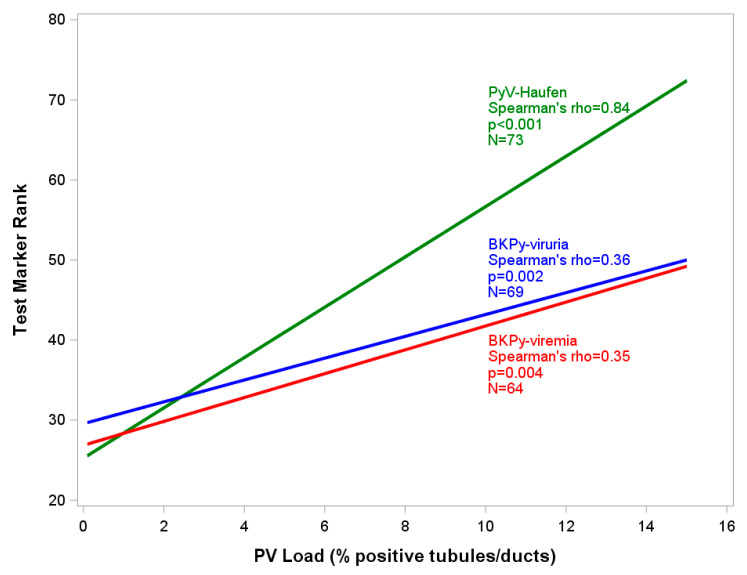
Figure 7.
Severity of PyVN and corresponding test marker expression. Rank linear regression modelling the relationship between quantitative marker test results (y-axis) and PyVN disease severity (x-axis). Y-axis: PyV-Haufen: # per mL urine; BKPy-viremia: quantitative PCR test with viral gene copy equivalents/mL plasma; BKPy-viruria: quantitative PCR test with viral gene copy equivalents/mL urine. For individual test results, ranks were used in place of actual test values. X-axis: percentage of virally injured tubules/Banff-pv load in index biopsy based on SV40-T expression by immunohistochemistry. For clarity, the x-axis is truncated at the 16% mark, since >98% of index biopsies showed a pv load <16%. N lists the number of samples available for testing in each of the three marker categories. Green: PyV-Haufen shedding; blue: BKPy-viruria; Red: BKPy-viremia.

