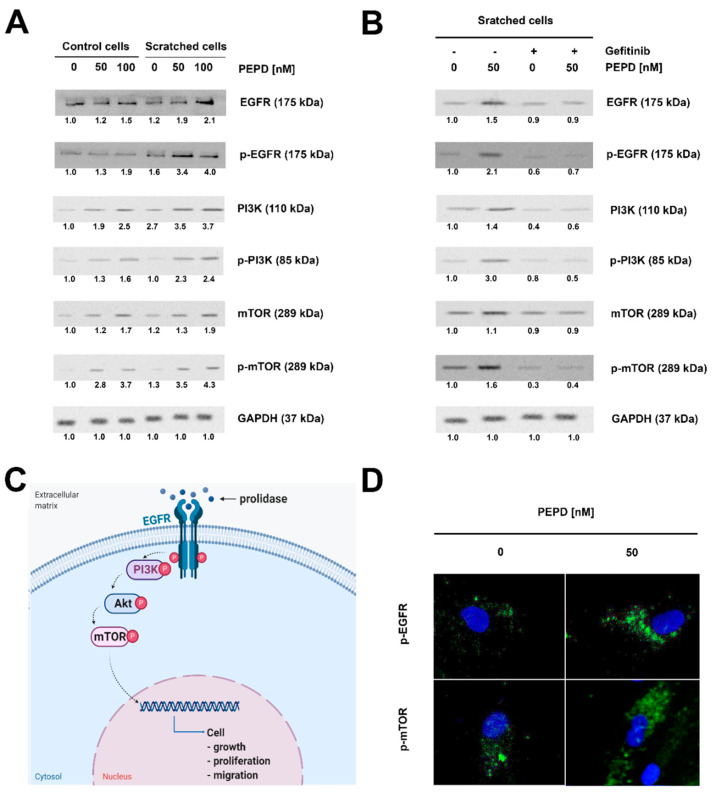
Figure 3.
Extracellular PEPD-induced epidermal growth factor receptor (EGFR)-downstream signaling pathway. (A) Western blot for the proteins of EGFR-downstream signaling pathway in lysates of control and “scratched” PEPD-treated fibroblasts (PEPD, 1−100 nM) for 24 h or PEPD-treated fibroblasts (PEPD, 0 and 50 nM) with an inhibitor of EGFR (Gefitinib pretreated cells for 2 h, 0 and 45 µM) for 24 h. GAPDH was used as a loading control. (B) Representative blot images were shown (densitometry of protein stains is presented under protein bands as a ratio versus control; Supplementary Figure S1). GAPDH was used as a loading control. (C) Illustration of the PEPD-dependent EGFR-downstream signaling pathway. Created with BioRender.com. (D) Representative results of immunostaining of p-EGFR and p-mTOR in PEPD-stimulated fibroblasts (50 nM) for 24 h are presented; magnification 200×.

