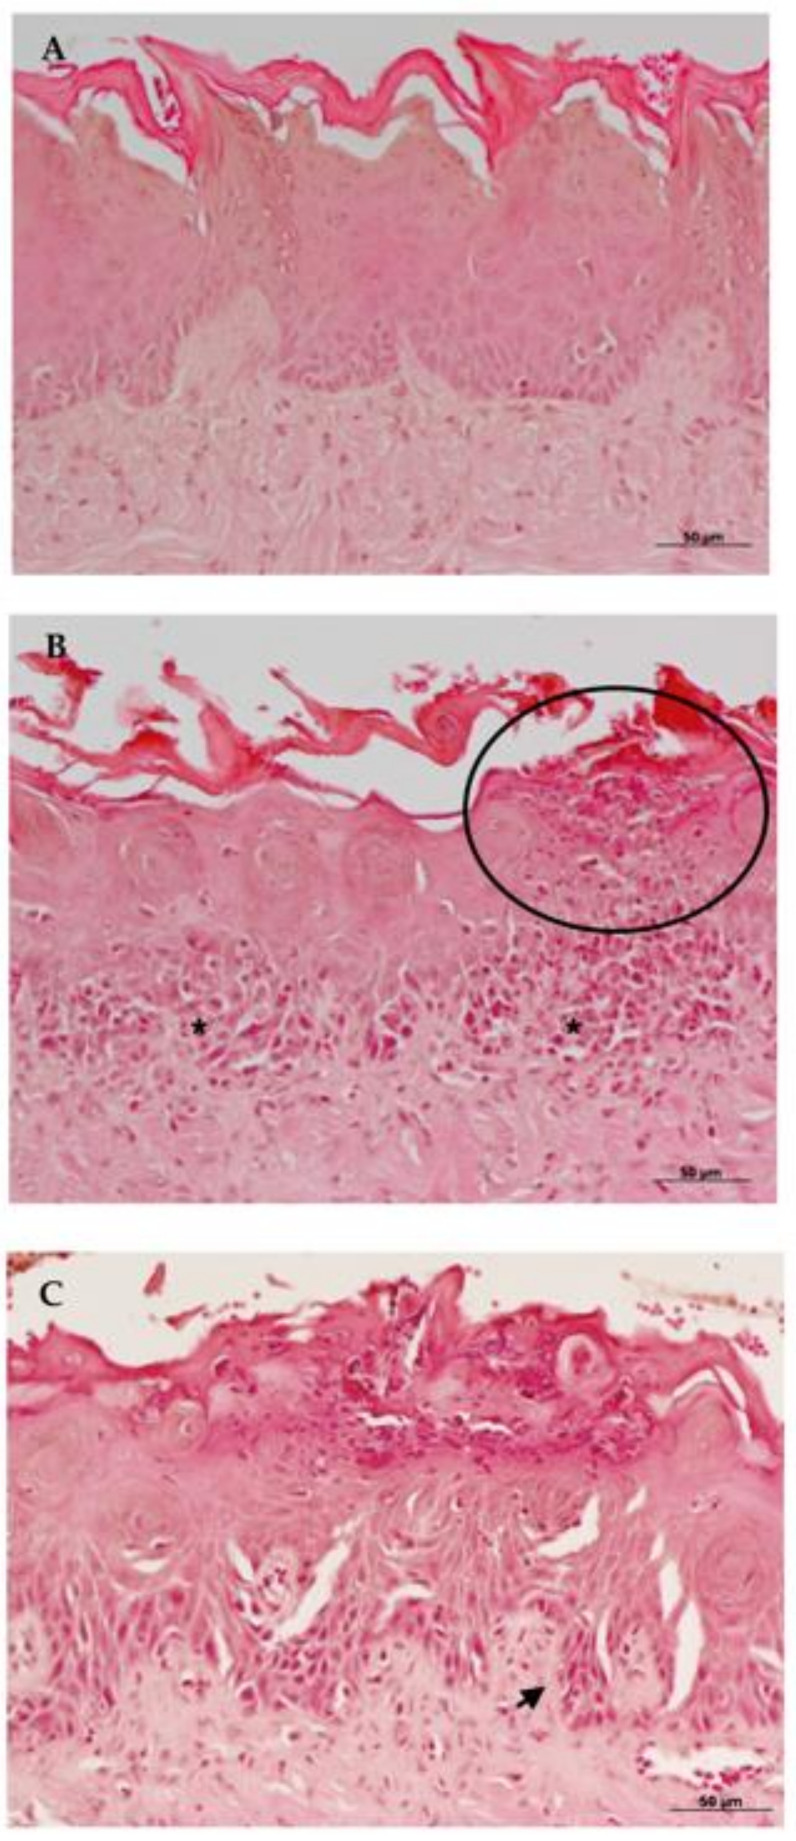
Figure 5.
Histological sections from 96-h groups stained by HE in 200× magnification. Group treated with: (A) Nystatin, (B) ellagic acid complexed in HP-β-CD (EA/HP-β-CD), and (C) Control Group. Arrows show alterations on the basal layer. The circle highlights micro-abscess formation in the epithelium. (*) shows intense exocytosis in the basal layer of the epithelium.

