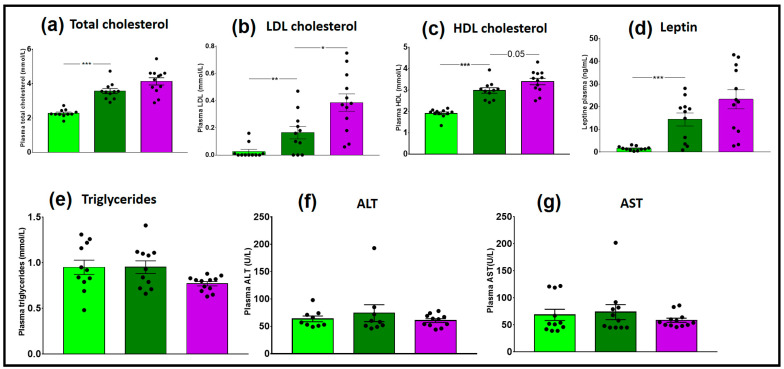
Figure 5.
Plasma assay of CD- and 2HFD-fed HR vs. NAFLR mice, n = 11–12 mice/group. (a) Total cholesterol; (b) low-density lipoprotein (LDL) cholesterol; (c) high-density lipoprotein (HDL) cholesterol; (d) leptin; (e) triglycerides; (f) ALT; (g) AST. Light green, HR_CD, HR mouse on CD; dark green, HR_2HFD, HR mouse on 2HFD; purple, NAFLR_2HFD, NAFLR mice on 2HFD; LDL, low-density lipoprotein; HDL, high-density lipoprotein; ALT, alanine transaminase; AST, aspartate transaminase; HR, healthy human microbiota receiver mice; CD, control diet; 2HFD, high-fructose, high-fat diet; NAFLR, NAFL patient microbiota receiver mice; (* p < 0.05, ** p < 0.01, *** p < 0.001) were used for statistical comparisons.

