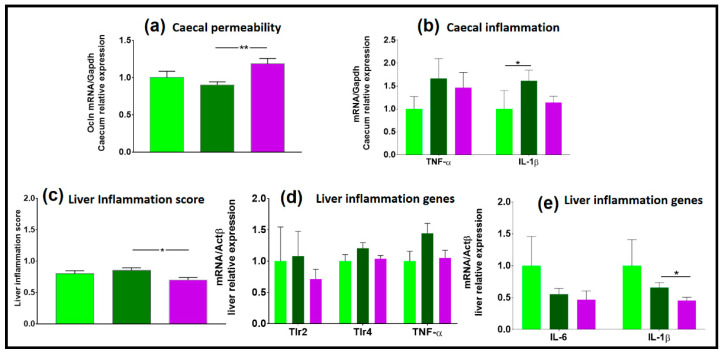
Figure 7.
Gene expression in the caecum and in the liver, n = 12 mice/group. (a) Caecal permeability; (b) caecal inflammation; (c) liver inflammation score; (d,e) liver genes involved in inflammation. HR, healthy human microbiota receiver mice; CD, control diet; 2HFD, high-fructose, high-fat diet; NAFLR, NAFL patient microbiota receiver mice; light green, HR_CD, HR mice on CD; dark green, HR_2HFD, HR mice on 2HFD; purple, NAFLR_2HFD, NAFLR mice on 2HFD; (* p < 0.05, ** p < 0.01) were used for statistical comparisons.

