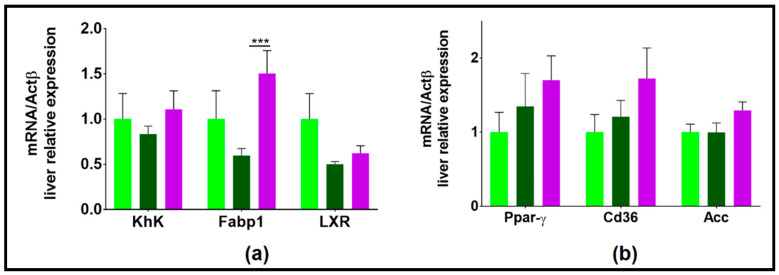
Figure 9.
Hepatic expression of genes involved in lipid and carbohydrate metabolisms. (a) genes whose expression tended to decrease with 2HFD and then tended to increase with NAFL microbiota (b) genes whose expression tended to increase with 2HFD and even more with NAFL microbiota; HR, healthy human microbiota receiver mice; CD, control diet; 2HFD, high-fructose, high-fat diet; NAFLR, NAFL patient microbiota receiver mice; light green, HR_CD, HR mice on CD; dark green, HR_2HFD, HR mice on 2HFD; purple, NAFLR_2HFD, NAFLR mice on 2HFD; (*** p < 0.001) was used for statistical comparisons.

