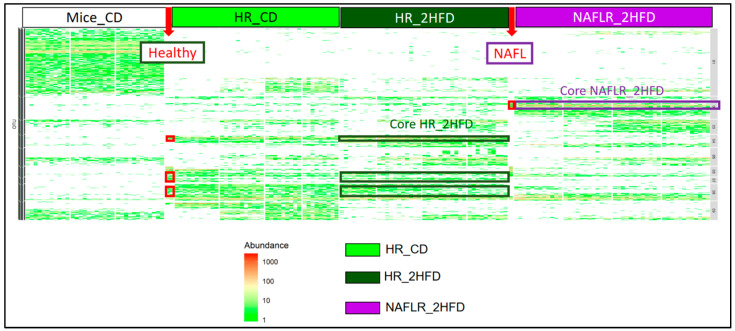
Figure 10.
Heatmap characterization of differentially abundant and prevalent operational taxonomic units (OTUs) all throughout the experiment. CD, control diet; 2HFD, high-fructose, high-fat diet; Mice_CD, mice microbiota at basal state, day 6, on CD; Healthy, healthy human microbiota; NAFL, NAFL patient microbiota; HR, healthy human microbiota receiver mice; NAFLR, NAFL patient microbiota receiver mice; HR_CD, HR on CD regimen; HR_2HFD, HR on 2HFD regimen; NAFLR_2HFD, NAFLR on 2HFD regimen.

