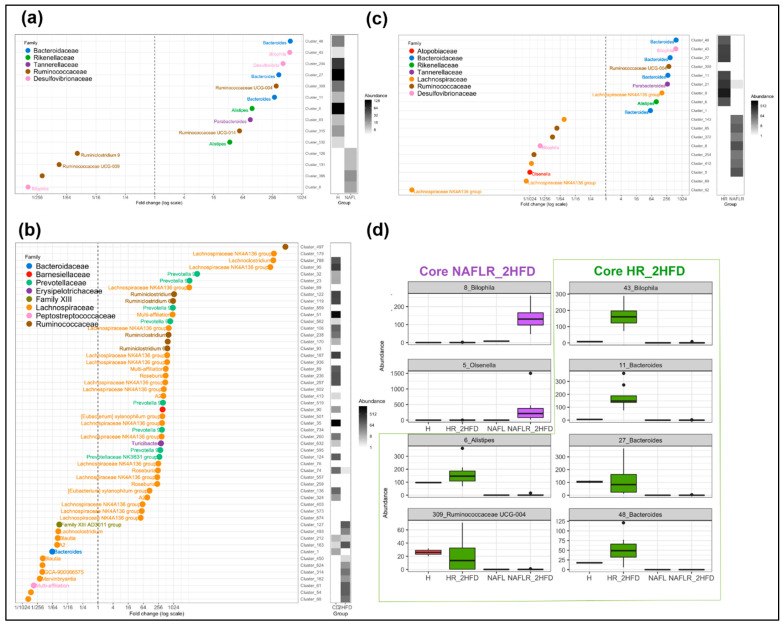
Figure 11.
Graphical representation of differentially abundant OTUs, having a large fold change and significant effect size in addition to high relative abundance between (a) healthy, H, and NAFL inocula; (b) HR_CD and HR_2HFD groups on day 90; (c) HR_2HFD and NAFLR_2HFD groups on day 90. Each OTU is represented by a dot and colored according to its taxonomic classification at the family level. Taxonomy at the genus or species level is also indicated, when available, next to each OTU. A logarithmic scale (log-2) was used for the x axis. (d) Core NAFLR_2HFD and Core HR_2HFD abundance through the groups, corresponding, respectively, to the OTUs differentially abundant and transferred from inocula to mice. HR, healthy human microbiota receiver mice on 2HFD; NAFLR, NAFL patient microbiota receiver mice on 2HFD; 2HFD, high-fructose, high-fat diet.

