
FIGURE 5.
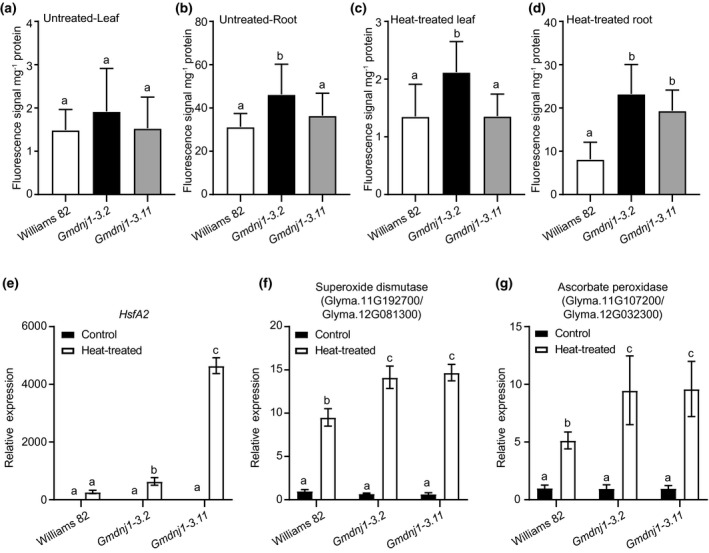
ROS contents and expressions of genes encoding ROS‐scavenging enzymes in Gmdnj1 mutant lines. The ROS contents in leaf (a) and root (b) of untreated plants, and in leaf (c) and root (d) of heat‐treated plants were compared by measuring the H2DCFCA fluorescence per unit protein in the extract. Expressions of HsfA2 (e), heat shock element containing superoxide dismutase‐encoding genes (f), and heat shock element containing ascorbate peroxidase‐encoding genes (g) in root of Gmdnj1 mutant were monitored. The data in a–d were analyzed with one‐way ANOVA followed by LSD test. Different letters above the bars indicate means that are significantly different at p < .05. N ≥ 4. Error bar: SEM. The data in (e–g) were analyzed with one‐way ANOVA followed by Tukey's test. Different letters above the bars indicate means that are significantly different at p < .05. N ≥ 3. Error bar: standard deviation. Replicate of the experiment can be found in Figure S7