Figure 3.

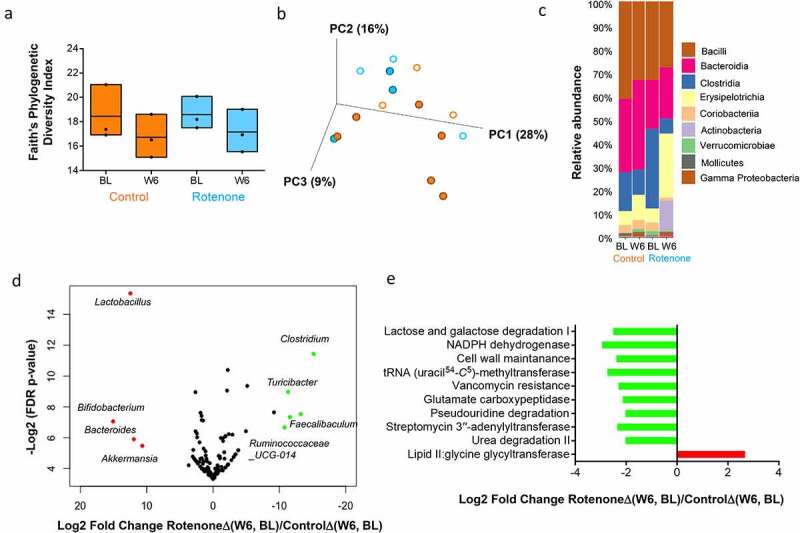
Changes in gut microbiota composition following rotenone or vehicle treatment in CR mice. (a) Change in α-diversity from baseline (BL) to week 6 (W6) following rotenone (blue) or vehicle (orange) treatment in conventionally raised (CR) mice was assessed using Faith’s phylogenetic diversity index. Kruskal–Wallis (pairwise) test, vehicle control: BL vs W6, q = 0.6; rotenone: BL vs W6, q = 0.6; BL: rotenone vs vehicle control, q = 0.7; W6: rotenone vs vehicle control, q = 0.7. A comparison of the change in α-diversity from BL to W6 following rotenone [RotenoneΔ(W6, BL)] or vehicle treatment [ControlΔ(W6, BL] shows no statistically significant difference (Wilcoxon Sign-Rank Test) between the treatment groups. (b) Bray Curtis-based PCoA plot (2-dimensional representation of 3-dimensional plot) of gut microbial communities in CR mice treated with vehicle solution (orange; control group) or rotenone solution (blue). BL samples are represented by open circles while W6 samples are represented by filled circles. There was no statistically significant difference in beta diversity at BL (PERMANOVA test; q = 0.26) or W6 (PERMANOVA test; q = 0.23) between rotenone and vehicle-treated mice. A comparison of the change in beta diversity from BL to W6 following rotenone [RotenoneΔ(W6, BL)] or vehicle treatment [ControlΔ(W6, BL] shows no statistically significant difference (Wilcoxon Sign-Rank Test) between the treatment groups. (c) Bar plot showing changes in relative abundance of different bacterial classes from BL to W6 following treatment of CR mice with rotenone (blue) or vehicle (orange). (d) Volcano plot showing compositional difference in gut microbiota between vehicle (control) and rotenone treated CR mice. Log2-transformed fold change in microbiota composition (RotenoneΔ(W6, BL)/ControlΔ(W6, BL)) is plotted on the x-axis and log-transformed, FDR adjusted p-values are plotted on the y-axis. Bacterial genera that are significantly increased [FDR adjusted P < .05] following rotenone administration are represented in red while those that are significantly decreased are represented in green. (e) Comparison of the change in predicted microbial metabolic pathways (PICRUSt) FDR<0.25) from BL to W6 following vehicle and rotenone treatment in CR mice [RotenoneΔ(W6, BL)/ControlΔ(W6, BL)]. Pathways (FDR<0.25) that are significantly increased are shown in red while those that are significantly decreased following rotenone administration are shown in green
