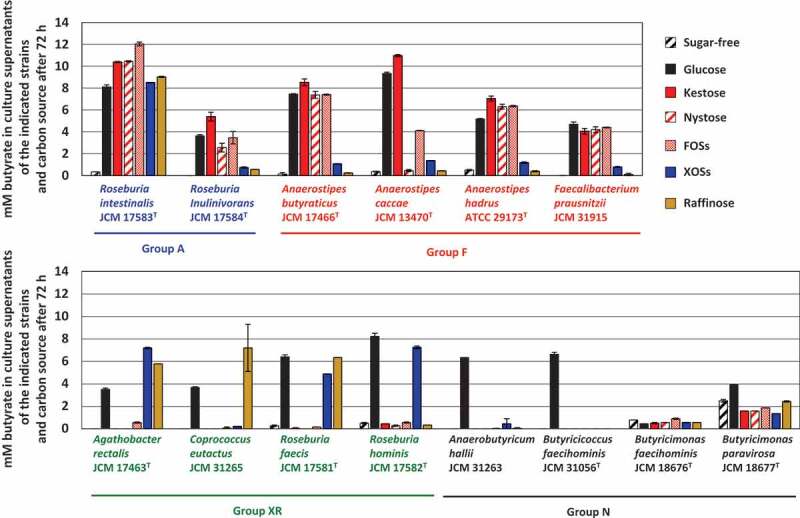
Figure 2.

Concentration of butyrate in culture supernatants of 14 butyrate producers in the presence of each oligosaccharide (0.5%, w/v) after incubation of 72 h. Bars and error bars indicate means and standard deviations from triplicates, respectively. Groups A, F, XR, and N correspond to the metabolic groups shown in Figure 1
