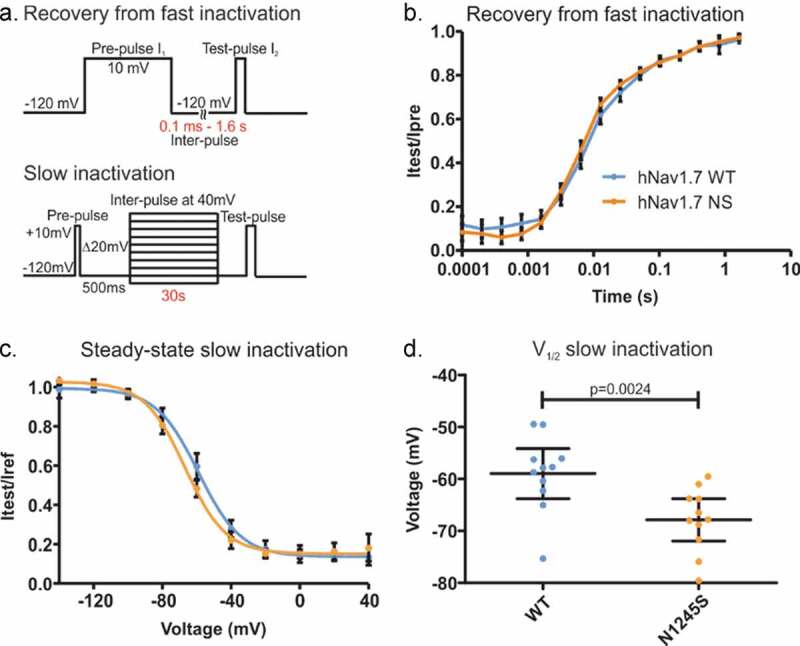
Figure 5.

The N1245S variant enhances slow inactivation. (a) Voltage protocols of recovery from fast inactivation (top) and slow inactivation (bottom). (b) Time course of recovery from fast inactivation. Peak current at the test-pulse (I2) was normalized to the peak obtained during the pre-pulse (I1) and plotted against inter-pulse duration using a logarithmic scale. WT in blue, n = 32; N1245S in orange, n = 23. (c) Voltage dependence of steady-state slow inactivation. Peak current at the test-pulse was normalized to the peak obtained during the pre-pulse and plotted against the inter-pulse voltage and fit with a Boltzmann function. WT in blue, n = 11; N1245S in orange, n = 11. (d) V1/2 values of slow inactivation were obtained based on the data in (c). Error bars denote 95% confidence interval. These recordings were performed without co-transfection of the Nav β1 subunit
