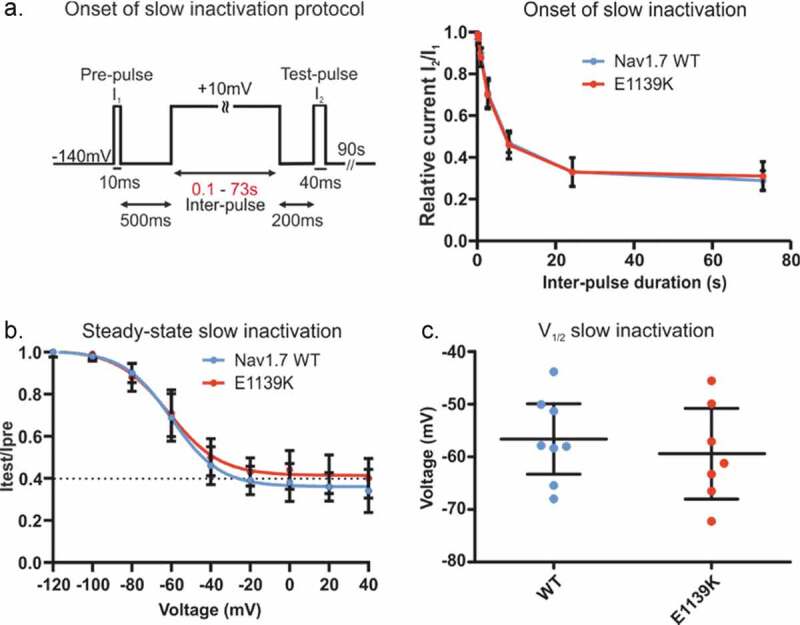
Figure 8.

E1139K and WT channels show similar onset and steady-state slow inactivation. (a) Voltage protocol of onset of slow inactivation (left) and time course of slow inactivation (right). The peak current at the test-pulse was normalized to the peak current at the ref-pulse and plotted against pre-pulse duration (s) for the E1139K variant (red, n = 11) and the Nav1.7 WT (blue, n = 9) channels. (b) Voltage dependence of steady-state slow inactivation. For protocol, see Figure 5a. Peak current at the test-pulse was normalized to the peak obtained during the pre-pulse and plotted against the pre-pulse voltage to fit the data with a Boltzmann function for E1139K variant (red, n = 10) and Nav1.7 WT (blue, n = 11). (c) V1/2 values of slow inactivation were obtained based on data in (b). No difference was observed. Error bars denote 95% confidence interval. These experiments were performed in the absence of β subunits
