Figure 1.

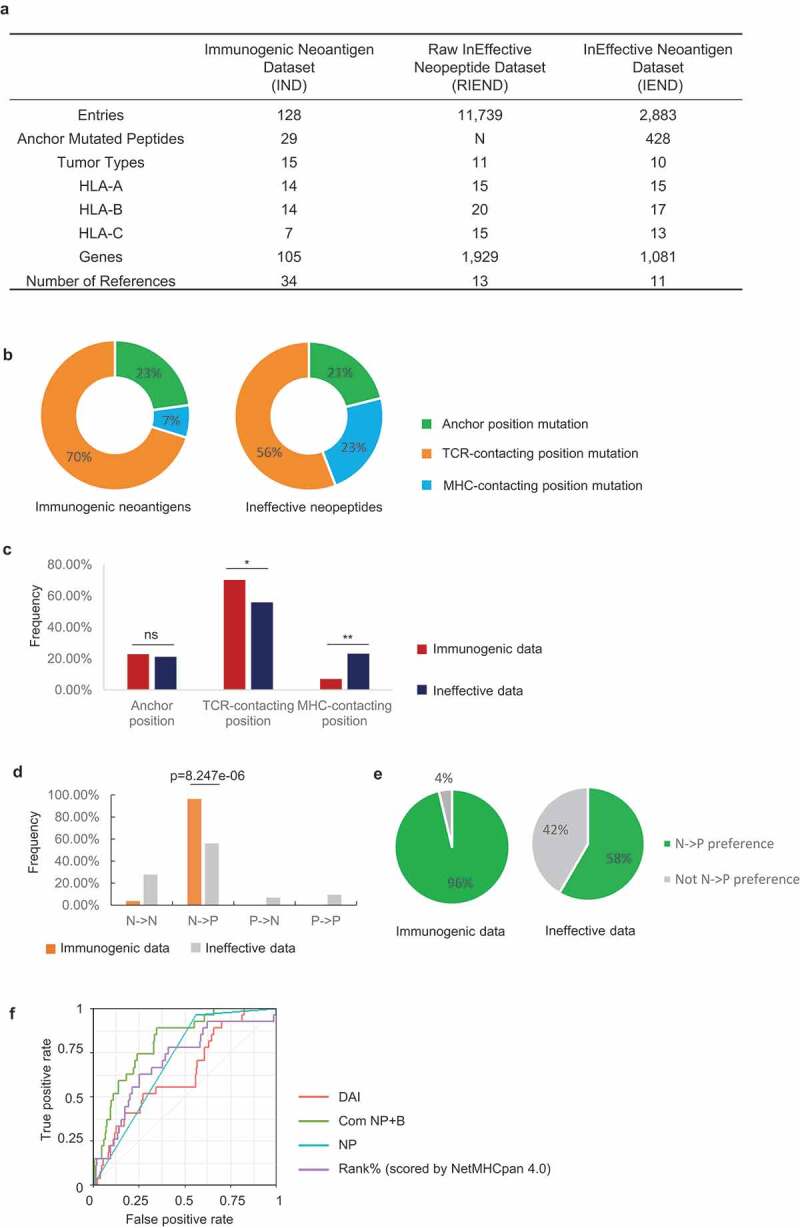
Immune-based classification of data from the Immunogenic neoantigen dataset (IND) and Ineffective neopeptides dataset (IEND). a, Overview of the IND, RIEND, and IEND datasets. b, Donut plots of the percentage of 9mer neoantigen/neopeptides, categorized into three classes based on different mutation positions: anchor mutation, MHC-contacting position, and TCR-contacting position (immunogenic data, n =51; ineffective data, n=763). c, Nonameric peptides mutation distribution of three classes (mutated at anchor mutation, MHC-contacting position, and TCR-contacting position) from IND and IEND. The frequency of mutation distribution at TCR-contacting position and MHC-contacting position showed significant difference (TCR-contacting position, p=0.0378; MHC-contacting position, P=0.0027. n (immunogenic) =51; n (ineffective) =763. Fisher’s exact test). The percentage of mutation distribution at the anchor position did not show a significant difference between immunogenic and ineffective data (ns, non-significant). d, Nonameric peptides distribution of four subgroups (NN, NP, PN, and PP). A significant difference was observed in the NP group (p=8.247e-06, n=27 (immunogenic); n=425 (ineffective), Fisher’s exact test). e, Pie charts represented the percentage of the NP group and non-NP groups in IND and IEND (n (immunogenic) = 27; n (ineffective) =425). f, Receiver operator characteristic (ROC) curve showed the performance of four prediction models (DAI score, binary NP rule, binding prediction (Rank% scored by NetMHCpan 4.0), combination of NP rule + binding prediction (Com NP+B)) with anchor mutated data (data from IND and IEND, n (immunogenic) = 27; n (ineffective) =425). The AUC (Area Under the ROC Curve) was calculated for each predictive model (AUCDAI= 0.632; AUCNP rule =0.701; AUCcom NP-B =0.810; AUC Rank%=0.698)
