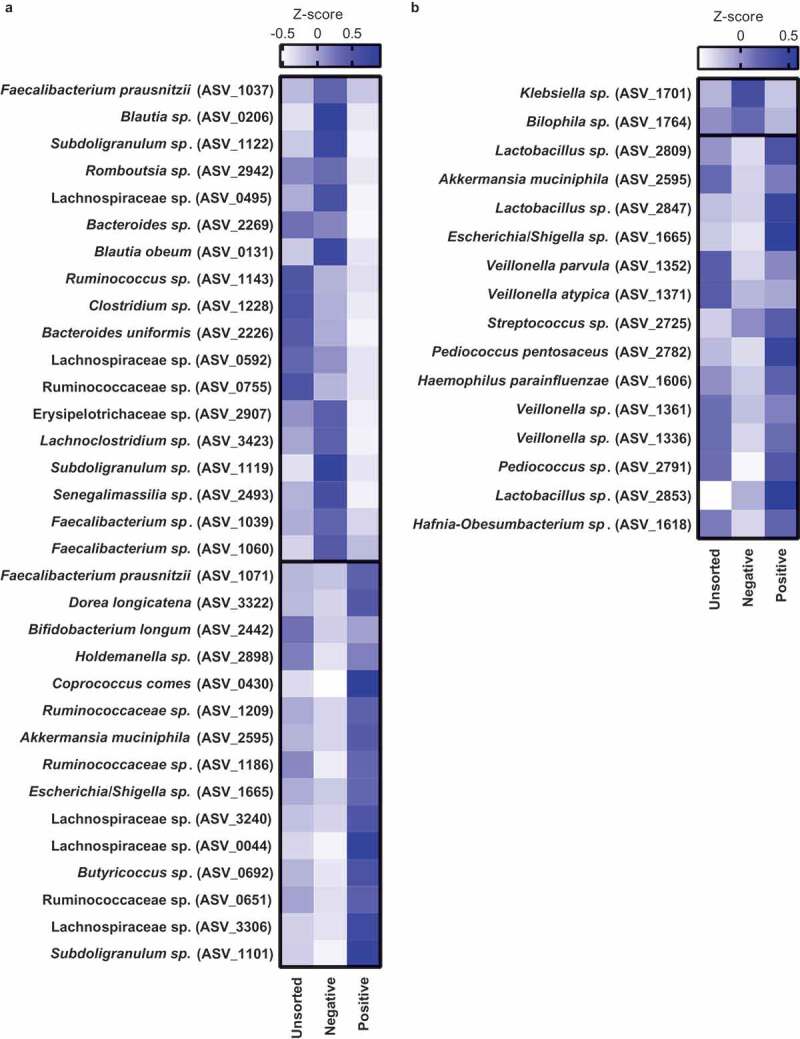
Figure 4.

IgA-coated bacteria before and after vancomycin treatment
Healthy lean (n = 10) and obese people with metabolic syndrome (n = 9) were given vancomycin for 7 days. Intestinal bacteria were sorted and sequenced before (A) and after treatment (B). The heatmaps show the most abundant bacteria (>0.1%, present in >60% of the participants) that are significantly (p < .05) enriched either in the IgA negative (top) or positive (bottom) fraction. The heatmaps are sorted according to their relative abundance (bottom-to-top per fraction). Z-scores of their abundance are shown. Statistical analysis was performed using the Wilcoxon matched-pairs signed-rank test.
