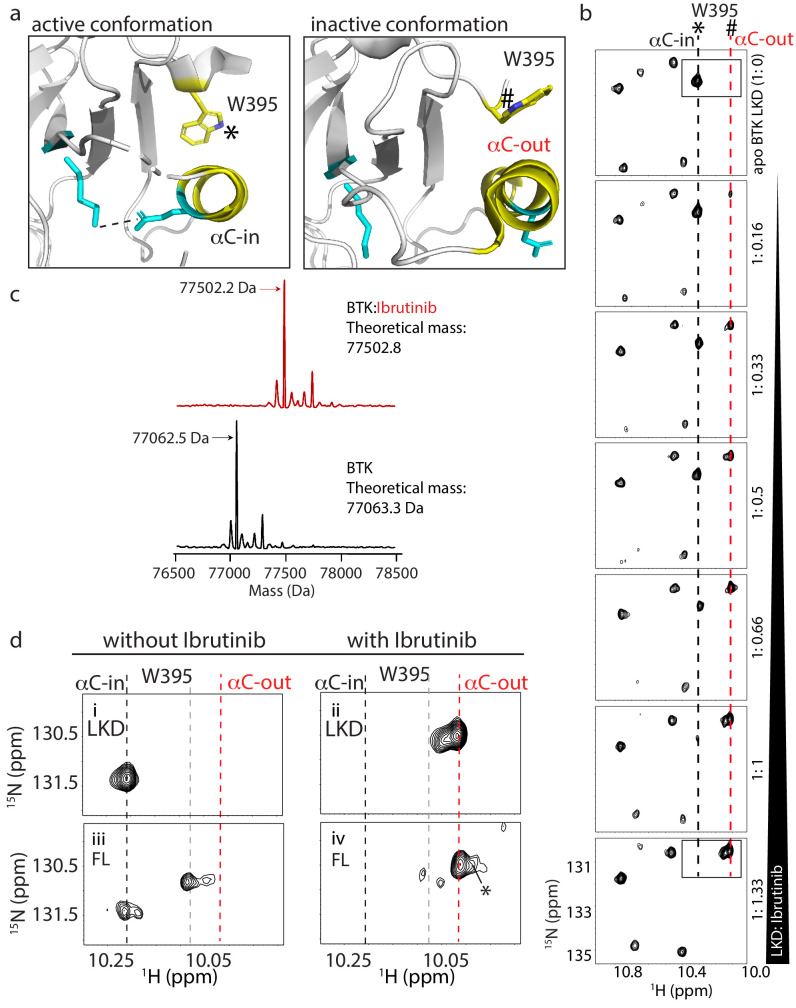
Figure 2. W395 indole NH resonance reports on the conformation of BTK.
(a) Close-up of the structural differences surrounding the αC helix, W395, and the Lys/Glu salt bridge for structures of the active Bruton’s tyrosine kinase (BTK) kinase domain conformation (PDB ID: 3K54) and the inactive BTK kinase domain conformation (PDB ID: 5P9J). W395 and the αC helix are labeled depicted in yellow while the Lys/Glu sides chains are shown in cyan (as in Figure 1d). A dashed line between the Lys/Glu pair indicates the presence of the salt bridge between these side chains in the active kinase conformation. The downfield resonance in (b) corresponds to the W395 indole NH indicated with * and the upfield resonance in (b) corresponds to the W395 indole NH indicated with #. (b) Titration of Ibrutinib into 15N-labeled BTK LKD. Tryptophan side chain region of the 1H-15N TROSY HSQC spectrum of BTK LKD shows that addition of increasing concentrations of Ibrutinib (top to bottom) decreases the intensity of the downfield BTK W395 resonance (corresponding to the kinase active (αC-in) conformation, dashed black line), and increases the intensity of the W395 resonance in the upfield position, corresponding to the kinase inactive (αC-out) state (dashed red line). The molar ratio of linker kinase domain (LKD) to Ibrutinib is indicated on the left of each panel. All samples contain the same DMSO concentration. The * and # symbols are defined in (a). (c) Intact mass analysis of wild-type FL BTK before (bottom spectrum, black) and after 15-min incubation with a twofold molar excess of Ibrutinib (top spectrum, red) showing a mass increase of one Ibrutinib molecule. The peaks corresponding to the mass of BTK or BTK:Ibrutinib are identified with arrows. (d) Expanded tryptophan side chain region of the 1H-15N TROSY HSQC spectra showing the resonance(s) of W395 for BTK LKD and FL without (left, i and iii) and with Ibrutinib (right panels, ii and iv) The black dashed line in the most downfield position and the upfield red dashed line corresponds to that in (a). The gray dashed line indicates the position of the W395 1H frequency in FL BTK in the apo inactive (αC-out) state. Asterisk indicate the additional peak (W251) that is evident upon Ibrutinib binding to FL. All NMR samples contain 2% DMSO to ensure the solubility of Ibrutinib. At this concentration, DMSO does not perturb the structure of the protein as comparison of 1H-15N TROSY HSQC spectra of the BTK proteins in the presence or absence of 2% DMSO shows no significant changes (data not shown).


