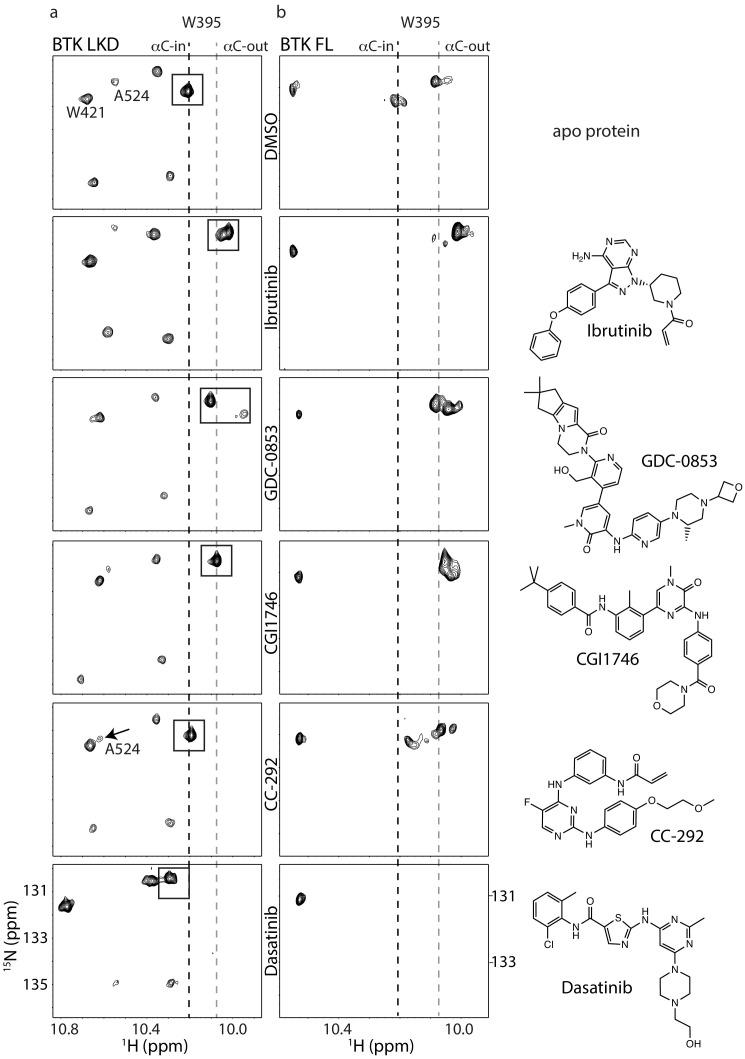
Figure 4. Assessing the BTK kinase domain conformational state as a function of inhibitor binding by solution NMR.
The structures of each inhibitor are shown on the right. The broken lines show the positions of the BTK W395 resonance in the active (αC-in) and inactive (αC-out) states as in Figure 2b. (a) The tryptophan side chain region of the 1H-15N TROSY HSQC spectra of 15N-labeled apo BTK linker-kinase domain (top panel) or bound to various inhibitors (below). The BTK W395 NH resonance (boxed peak) is in the inactive position in the Ibrutinib-, GDC0853-, and CGI1746-bound BTK LKD samples. The BTK W395 resonance is maintained in the active, downfield position in the BTK:CC-292 complex and shifted further downfield in the spectrum of the BTK:Dasatinib complex. The chemical shift change observed for A524 resonance in the BTK LKD:CC-292-bound spectrum confirms the binding of CC-292 to BTK LKD despite lack of change in the W395 resonance. (b) The tryptophan side chain region of the 1H-15N TROSY HSQC spectra of 15N-labeled apo BTK full-length (top panel) or bound to various inhibitors (below). The BTK W395 NH resonance is in the inactive (αC- out) position in the Ibrutinib-, GDC0853-, and CGI1746-bound BTK FL samples. Multiple peaks are observed spanning the active and inactive positions of W395 in the CC-292-bound BTK FL spectrum suggesting that the kinase domain is dynamic and adopts a range of conformations. The W395 resonance is broadened beyond detection in the Dasatinib-bound BTK FL spectrum.

