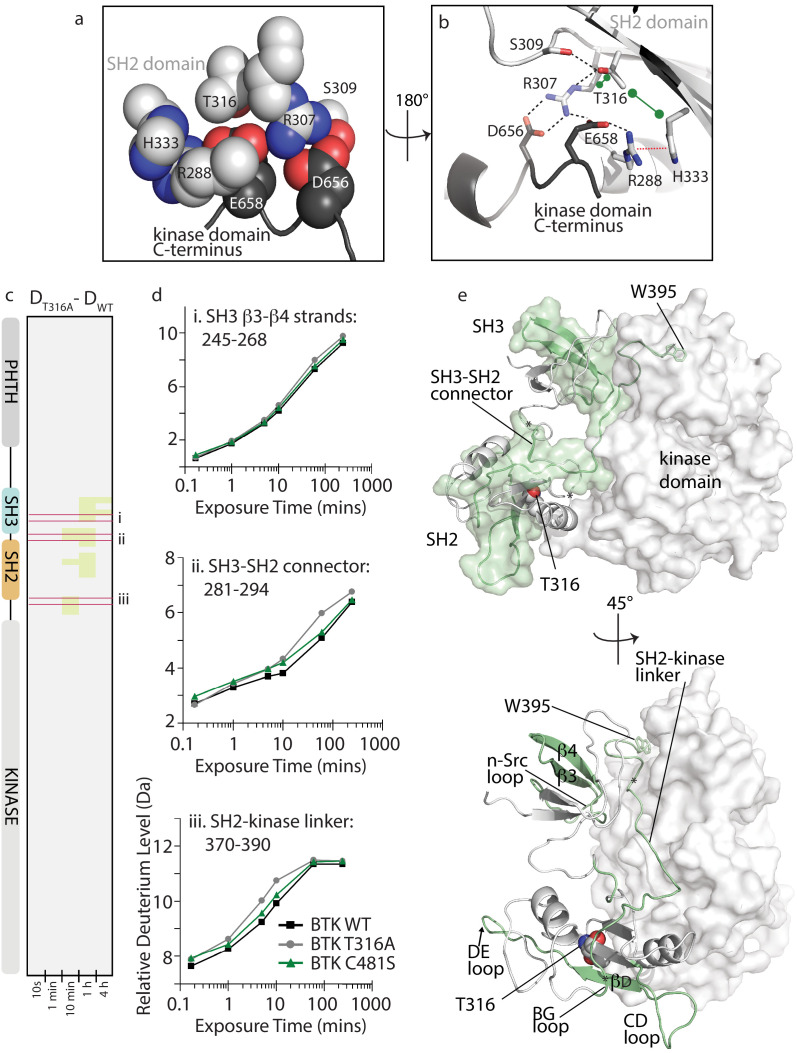
Figure 7. BTK T316A mutation disrupts the autoinhibitory conformation of BTK.
(a,b) Close-up views of the BTK 32LKD structure (PDB ID: 4XI2) illustrating the network of interactions involving the side chain of T316. In (a), the sidechains are depicted in spheres and labeled, all SH2 sidechains are in light gray, and the two sidechains from the kinase domain C-terminus are in dark gray. Using the same color scheme, the structure is rotated in (b) and shows the sidechains in stick format as well as the cartoon of this part of the SH2 domain structure. Black dashed lines indicate potential for hydrogen bonds, the red dashed line indicates a cation-pi interaction, and the green dumbbell indicates potential for hydrophobic packing. (c) HDX difference data for the BTK T316A mutant (DT316A-DWT). Color scale and peptide/time course arrangement are the same as in Figure 5. See Source data 1 for additional information, including all peptide identifications and deuterium values. (d) Deuterium uptake curves from peptides indicated by red boxes in panel c, (labeled i, ii, and iii), which show an increase in deuterium uptake in the BTK T316A mutant versus BTK WT. (e) Two views of the structure of BTK 32LKD (PDB ID: 4XI2) showing the regions of increased deuteration (green surface and cartoon) upon T316A mutation. T316 sidechain in the BTK SH2 domain is indicated in spheres. Specific regions of secondary structure in the SH3 and SH2 domains that are more deuterated upon T316A mutation are labeled in the lower panel.

